A decade-long seller’s market in the Twin Cities still going strong

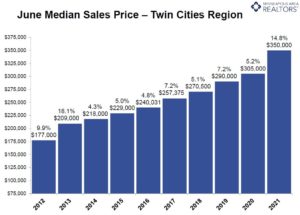
(November 16, 2021) – According to new data from Minneapolis Area REALTORS® and the Saint Paul Area Association of REALTORS®, the median sales price in the Twin Cities rose 7.9 percent from October 2020 to $340,000. Despite the housing shortage, price growth is returning to more typical levels even as we mark 10 full years of a sellers’ market.

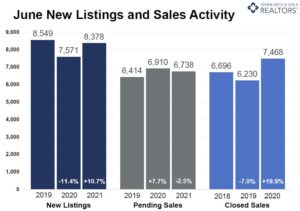
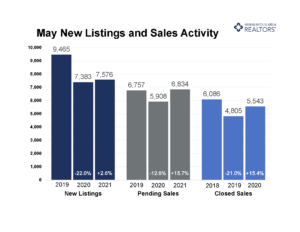
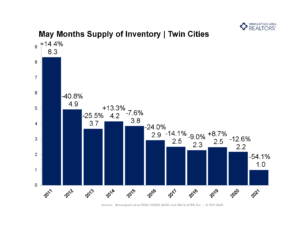
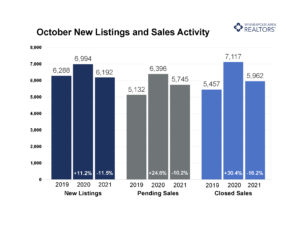
New listings in the metro fell 11.5 percent from last October and are 1.5 percent below their 2019 level. While pending sales also dipped 10.2 percent from last year, buyer activty is up 11.9 percent from 2019. Closed sales were also down from 2020 but up from 2019. Last month also marked the Twin Cities’ 10th straight year in a metro-wide seller’s market. We’ve had under 5.0 months supply of inventory for every month of every year since November 2011. Over the last year, however, we’ve seen those absorption rates contract to 1.0 month of supply. Six months of supply is considered a balanced market. The three primary drivers of this is strong demand, weak listing activity and tight inventory levels.

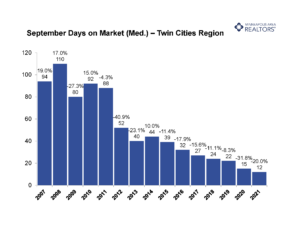
“We’re still stuck in this period of apples-to-oranges year-over-year comparisons where we’re up against a uniquely strong pandemic market,” said Todd Walker, President of Minneapolis Area REALTORS®. “And as inflation concerns grow, cash downpayment savings can lose value. As rates rise, it’s possible some buyers move up their purchase timeline.” As we embrace fall and begin to cool down seasonally, listings tend to take longer to sell than in spring or summer. Half of the listings in the metro area sold in fewer than 14 days. While that pace is flat from last year, time on market is down 44.0 percent from 2019, and 14 days is a record fast pace for any October going back to 2007 and likely earlier. Sellers accepted, on average, 100.3 percent of their list price, down slightly from last October.

Inventory levels were down 16.2 percent compared to a 40.5 percent decline back in May. “Pricing has remained firm from all the demand still in the market as well as the supply squeeze,” according to Tracy Baglio, President of the Saint Paul Area Association of REALTORS®. “While still rising, the rate of year-over-year price growth has slowed from 16.6 percent in May to around 8.0 percent last month.”

Market activity varies by area, price point and property type. Home sales more than doubled in Loring Park and Bryant and doubled in the Folwell and Lyndale neighborhoods, but fell between 60.0 and 80.0 percent in Kenwood, Kenny and Armatage. Sales in Centerville rose 83.3 percent and 46.7 percent in Princeton but fell 71.4 percent in Wayzata and 61.3 percent in New Prague. The price range with the largest gain in demand was the $1M+ luxury sector, where sales have surged 47.3 percent over the last 12 months. Sales between $150,000 and 190,000 dropped 30.1 percent. In August, closed sales in Minneapolis reached their highest level since 2005, marking a 16-year high for housing demand in the city. Though a small share overall, condo sales rose more than any other property type over the last year.

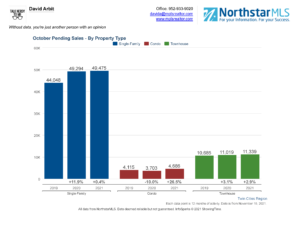
October 2021 by the numbers compared to a year ago

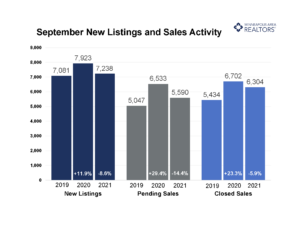
  • Sellers listed 6,192 properties on the market, an 11.5 percent decrease from last October
  • Buyers signed 5,745 purchase agreements, down 10.2 percent (5,962 closed sales, down 16.2 percent)
  • Inventory levels fell 16.2 percent to 7,657 units
  • Month’s Supply of Inventory was down 17.6 percent to 1.4 months (4-6 months is balanced)
  • The Median Sales Price rose 7.9 percent to $340,000
  • Days on Market decreased 22.9 percent to 22 days, on average (median of 14 days, level with October 2020)
  • Changes in Sales activity varied by market segment
    • Condo sales rose 3.8 percent, while single family & townhouse sales fell 18.8 percent and 11.5 percent respectively
    • Traditional sales were down 15.5 percent; foreclosure sales were down 61.4 percent; short sales fell 45.5 percent
    • Previously owned sales dropped 14.5 percent; new construction sales decreased by 28.6 percent

    All information is according to the Minneapolis Area REALTORS® and Saint Paul Area Association of REALTORS based on data from NorthstarMLS. We serve the Twin Cities 16-county metro area and western Wisconsin.

    From The Skinny Blog.

Twin Cities home sales down from frenzied 2021 market but up from 2019

(October 19, 2021) – According to new data from Minneapolis Area REALTORS® and the Saint Paul Area Association of REALTORS®, buyers closed on 16.0 percent more homes in the Twin Cities metro area last month compared to September 2019. Sales were down 5.9 percent, however, from the heightened pace of September 2020. The trend still indicates rising demand, and suggests that much of last year was an outlier and unsustainable.

Both seller and buyer activity were down from 2020 but up from 2019. While the number of signed purchase agreements fell 14.4 percent compared to September 2020, the two-year growth from 5,047 purchase contracts in 2019 represents a 10.8 percent gain. That amounts to about 5.4 percent demand growth per year, a stable and healthy rate. Buyers remain active and persistent, though perhaps a bit more cautious. But because much of 2020 and 2021 are not apples-to-apples, year-over-year comparisons will continue to be distorted.

“We are still in a period where year-over-year comparisons can be skewed,” said Todd Walker, President of Minneapolis Area REALTORS®. “We’ve gone from March 3 to March 1—still a fast pace, but agents are seeing fewer multiple offers. Bypassed inspections and appraisal gap clauses are also less prevalent.” The metro area remains a firm seller’s market with just 1.5 months supply of inventory. That’s the lowest figure for any September going back two decades. Historically, five to six months of supply is considered a balanced market that doesn’t favor one side or the other—buyer or seller.

Seller activity declined 8.6 percent over the last year but rose slightly over the last two years. This is the region’s third consecutive year of September new listings exceeding 7,000, which hasn’t happened since 2007-2009. The median sales price for the metro rallied 10.2 percent from last year to $341,750. That’s shy of the $350,000 record high that held steady in June, July and August of this year. “While pricing remains firm, we’re at a time of year where activity typically slows down for the season,” according to Tracy Baglio, President of the Saint Paul Area Association of REALTORS®. “Even though we don’t quite see as fiercely competitive a market as last year or earlier this year, that doesn’t mean buyers suddenly have an upper hand, especially while sellers are still accepting offers over their list price and in record time.”

Activity varies by area, price point and property type. Home sales in Farmington rose 65.9 percent and in Golden Valley by 34.3 percent. Sales in Lino Lakes and Buffalo fell 51.7 percent and 48.3 percent respectively. Signed single family contracts fell 17.5 percent while condo agreements rose 10.4 percent. Sales of homes priced below $200,000 declined 33.6 percent while sales between $400,000 and $600,000 increased 22.2 percent compared to last year. Luxury home sales over $1M increased 7.0 percent from last September but are up 71.6 percent year-to-date.

September 2021 by the numbers compared to a year ago

  • Sellers listed 7,238 properties on the market, an 8.6 percent decrease from last September
  • Buyers signed 5,590 purchase agreements, down 14.4 percent (6,304 closed sales, down 5.9 percent)
  • Inventory levels fell 15.6 percent to 8,306 units
  • Month’s Supply of Inventory was down 21.1 percent to 1.5 months (4-6 months is balanced)
  • The Median Sales Price rose 10.2 percent to $341,750
  • Days on Market decreased 37.8 percent to 23 days, on average (median of 12 days, down 20.0 percent)
  • Changes in Sales activity varied by market segment
    • Condo & townhome sales fell 2.0 percent and 2.3 percent respectively, while single family home sales fell 6.0 percent
    • Traditional sales were down 4.8 percent; foreclosure sales were down 60.9 percent; short sales fell 66.7 percent
    • Previously owned sales dropped 4.2 percent; new construction sales decreased by 14.4 percent

From The Skinny Blog.

Like summer, housing remains strong and in-demand but not quite as hot

(September 17, 2021) – According to new data from Minneapolis Area REALTORS® and the Saint Paul Area Association of REALTORS®, listings throughout the Twin Cities sold quickly and often at or above list price. Though we remain undersupplied, there are signs of inventory stabilizing. The median sales price and price per square foot both increased.

Seller activity was down 3.6 percent while closed sales were up 0.6 percent. Pending sales—the number of signed purchase agreements—fell 10.3 percent from the frenzied pace of 2020 but remain above 2019 levels.

The 6,525 signed purchase agreements in August actually represent an 8.7 percent increase from August 2019. While we may struggle to reach the same level of demand from 2020, this upward trend in demand over two years confirms that buyer interest and activity remains strong. Median days on market fell 33.3 percent from last August to 10 days. This fast paced landscape where multiple offers remain common continues to push prices higher and allows some sellers to accept offers above their asking price.

“Even though these declines have moderated, incoming supply from new listings hasn’t changed much in recent years while, in fact, buyers have become more active,” said Todd Walker, President of Minneapolis Area REALTORS®. “Some of this arises from the fact that last year’s market was atypical and was shifted later into the year than a typical spring and summer market due to COVID.” The metro remains a seller’s market with just 1.4 months supply of inventory. Historically, six months of supply is considered a balanced market. That’s the lowest figure for any August going back to 2003.

The median sales prices remained at a record high of $350,000 for the third straight month. That’s an 11.1 percent increase compared to August 2020. Home prices have likely reached their seasonal peak for the year, but year-over-year increases compared to 2020 are likely to continue. Sellers are also receiving 102.4 percent of their list price, on average.

“Lately, home prices have increased more than the ability of some buyers to afford them,” according to Tracy Baglio, President of the Saint Paul Area Association of REALTORS®. “One silver lining is that average 30-year mortgage rates have remained historically low around 2.9 percent through most of the summer. Historically low-interest rates are helping ease the monthly payment of the higher home prices.”

Activity varies by area, price point and property type. Sales of condominiums were up 11.3 percent in Minneapolis and up 17.1 percent in St. Paul. Across the 16-county Twin Cities region new construction sales fell 24.1 percent while previously owned sales rose 3.7 percent. Single-family home sales in Eden Prairie rose 63.0 percent as did those in Cottage Grove by 23.3 percent. Single-family homes in Hudson and Otsego fell, 23.2 percent and 21.3 percent respectively.

August 2021 by the numbers compared to a year ago

Sellers listed 7,644 properties on the market, a 3.6 percent decrease from last August
Buyers signed 6,525 purchase agreements, down 10.3 percent (6,858 closed sales, up 0.6 percent)
Inventory levels fell 20.1 percent to 7,686 units
Month’s Supply of Inventory was down 26.3 percent to 1.3 months (4-6 months is balanced)
• The Median Sales Price rose 11.1 percent to $350,000
Days on Market decreased 43.6 percent to 22 days, on average (median of 10 days, down 33.3 percent)
• Changes in Sales activity varied by market segment

      • Condo sales rose 11.3 percent while single family & townhome sales were level with August 2020
      • Traditional sales were up 1.9 percent; foreclosure sales were down 71.0 percent; short sales fell 53.3 percent
      • Previously owned sales rose 3.8 percent; new construction sales dropped 24.1 percent.

From The Skinny Blog.

Twin Cities Housing Market Returning to Historic Trends

(August 17, 2021) – According to new data from the Minneapolis Area REALTORS® and the Saint Paul Area Association of REALTORS®, buyer activity in the month of July more closely resembled a typical, pre-pandemic summer than the frenzied buying spree seen over the last year or so. Demand as measured by pending sales was down 11.2 percent from July 2020 but was flat compared to July 2019.

Meanwhile, seller activity in the Twin Cities Metro increased for a fourth consecutive month. The number of homes listed on the market during the month was up 0.7 percent from last year, partly a result of the pullback in seller activity last spring and summer.
“Buyer activity was remarkably strong around this time last year,” said Tracy Baglio, President of the Saint Paul Area Association of REALTORS®. “It’s important to put softening sales figures in context. We’re returning to a more typical market in line with the past five years. Compared to the frenzied pace of Summer 2020, that appears to be a slowdown, but it’s really just ‘normalization.’” Overall, sellers are still firmly in control of this market; that hasn’t changed. With just 1.3 months supply of inventory, the metro remains a sellers’ market. Historically, six months of supply is considered a balanced market.

Another hallmark of supply-constrained markets is fast market times. The median number of days a property remained on market declined 58.8 percent to seven days. In other words, half of the pending sales in July had accepted offers within a week of being listed. On the other hand, home prices were up 11.9 percent from last July to arrive at $350,000 for the month. That’s even with June, even though prices tend to reach their seasonal peak in June.
“With offers still coming in at an average of 3.6 percent over original asking price, more people are understanding the strength of this market,” according to Todd Walker, President of Minneapolis Area REALTORS®. “Any supply increase can readily be absorbed by the record demand in the marketplace, and any rebalancing or adjustment will take some time to play out.”

Activity varies by area, price point and property type. Sales of single-family homes were up 3.4 percent in Minneapolis and level in St. Paul, suggesting demand remained strong in the core cities. Condos were the only property type to grow in year over year sales. Across the 16-county Twin Cities region condo sales rose 8.6 percent. Sales of previously owned homes fell 2.5 percent while new construction dropped 23.9 percent.

July 2021 by the numbers compared to a year ago

    • Sellers listed 8,139 properties on the market, a 0.7 percent increase from last July
    • Buyers signed 6,202 purchase agreements, down 11.3 percent (6,695 closed sales, down 5.2 percent)
    • Inventory levels fell 25.3 percent to 7,590 units
    • Month’s Supply of Inventory was down 35.0 percent to 1.3 month (4-6 months is balanced)
    • The Median Sales Price rose 11.9 percent to $350,000
    • Days on Market decreased 53.7 percent to 19 days, on average (median of 7 days, down 58.8 percent)
    • Changes in Sales activity varied by market segment
      • Single family sales were down 5.5 percent; condo sales rose 8.6 percent; townhome sales decreased 5.3 percent
      • Traditional sales fell 4.2 percent; foreclosure sales were down 54.5 percent; short sales fell 42.9 percent
      • Previously owned sales were down 2.5 percent; new construction sales dropped 23.9 percent

      From The Skinny Blog.

Twin Cities Median Sales Price Hit Milestone $350,000

Buyers faltered for the first time in twelve straight months of increased demand

(July 16, 2021) – According to new data from the Minneapolis Area REALTORS® and the Saint Paul Area Association of REALTORS®, the median sales price for a home grew 14.8 percent to $350,000 in the Twin Cities metro area over the month of June. This milestone figure is the result of consistent year-over-year growth in median sales price. This year, all six months have experienced a 10.0 percent increase or greater in median sales price, amounting to a nominal increase of $49,000.

Buyer activity in June fell slightly, down 2.5 percent from 2020, after twelve straight months of strong upward momentum. Although this past month was inconsistent with the year-long positive trend, 2021 surpassed the benchmark set in 2019 by 10.9 percent when considering year-to-date performance. Additionally, median days on market for listings remained at a rapid seven days, indicating that demand for homes continues to stay strong.

“Declining buyer activity could be a result of the stiff competition buyers are facing and the end of quarantine restrictions that allow us to focus on family during the summer holidays,” according to Todd Walker, President of Minneapolis Area REALTORS®. “While increasing home prices are usually a good sign for our industry, frequent bids over asking price will naturally cause some buyers to wait out until the market softens and they have a better chance to secure their next home.”

Seller activity grew 10.7 percent last month, resulting in a year-to-date high of 8,378 homes. However, new listings in June were marginally below 2019 performance, down 2.0 percent. As buyer demand out-paced seller supply in the past two years, the Twin Cities continued to be a strong sellers’ market throughout June. The month’s supply of inventory for the metro area remained at 1.0 month, a figure that has not grown significantly all year.

“Although the supply of new listings for June was comparable with pre-COVID performance, there is not enough inventory to meet our current demand,” said Tracy Baglio, President of the Saint Paul Area Association of REALTORS®. “Our Realtors® and their clients are eager for a larger, more diverse, inventory in the housing market. A sustainable balance of buyers and sellers will lead to long-term success in our industry.”

Activity varies by area, price point and property type. Sales of single-family homes were up 47.7 percent in Minneapolis and up 43.3 percent in St. Paul, suggesting demand remains strong in the core cities. Condos continue to lead sales growth by property type. Across the 16-county Twin Cities region condo sales rose 70.5 percent. Sales of previously owned homes rose 23.6 percent while new construction rose 8.2 percent.

May 2021 by the numbers compared to a year ago• Sellers listed 8,378 properties on the market, a 10.7 percent increase from last June

Buyers signed 6,738 purchase agreements, down 2.5 percent (7,468 closed sales, up 19.9 percent)
Inventory levels fell 35.5 percent to 6,592 units
Month’s Supply of Inventory was down 47.6 percent to 1.1 month (4-6 months is balanced)
• The Median Sales Price rose 14.8 percent to $350,000
Days on Market decreased 52.4 percent to 20 days, on average (median of 7 days, down 61.1 percent)
• Changes in Sales activity varied by market segment

  • Single family sales were up 18.3 percent; condo sales rose 70.5 percent; townhome sales increased 13.5 percent
  • Traditional sales rose 21.5 percent; foreclosure sales were down 72.1 percent; short sales fell 16.7 percent
  • Previously owned sales were up 23.6 percent; new construction sales dropped 8.2 percent

From The Skinny Blog.

Demand for Homes Continues to Increase, Tightening Market Inventory

(June 16, 2021) – According to new data from the Minneapolis Area REALTORS® and the Saint Paul Area Association of REALTORS®, buyer activity in May was up 15.7 percent compared to last year, a twelfth-straight increase in month-over-month pending sales. Demand from buyers in the Twin Cities metro continues to out-pace the supply of new listings into the market.

Seller activity in May grew slightly in a year, up 2.6 percent from 2020, but dropped by 19.9 percent compared to 2019, our most recent pre-COVID year. The relative imbalance in performance between buyers and sellers has led to a strong seller’s market. Currently, the Twin Cities has 1.0 month’s supply of inventory. Typically, four to six months is considered a balanced market.

“Half of all listings in the Twin Cities have an accepted offer within a week,” according to Tracy Baglio, President of the Saint Paul Area Association of REALTORS®. “As the summer season begins to build, buyers need to continue to be prepared to make firm decisions and strong offers on a home.”

In May, homes spent a median seven days on market, which is down 56.3 percent from last year. The quick shelf life of listings is particularly impressive given that the median price of a home in the Twin Cities metro rose to $342,500, a 16.1 percent increase from last May. The 30-Year Fixed Rate Mortgage Average in the United States did not exceed 3.0 percent, giving buyers the ability to stretch their dollar further.

“Recent showing activity shows that prospective home buyers shifted their interests to more expensive homes,” said Todd Walker, President of Minneapolis Area REALTORS®. “Two years ago, listings priced under $200,000 saw the largest share of showing activity. This year listings around $250,000 have seen the greatest share of activity.”

Activity varies by area, price point and property type. Sales of single-family homes were up 42.1 percent in Minneapolis and 16.7 percent in St. Paul, suggesting demand remains strong in the core cities. Condos continue to lead sales growth by property type. Across the 16-county Twin Cities region condo sales rose 98.3 percent. Sales of previously owned homes rose 18.3 percent while new construction rose 5.5 percent.

May 2021 by the numbers compared to a year ago

  • Sellers listed 7,576 properties on the market, a 2.6 percent increase from last May
  • Buyers signed 6,834 purchase agreements, up 15.7 percent (5,543 closed sales, up 15.4 percent)
  • Inventory levels fell 46.9 percent to 5,687 units
  • Month’s Supply of Inventory was down 54.5 percent to 1.0 month (4-6 months is balanced)
  • The Median Sales Price rose 16.1 percent to $342,500
  • Days on Market decreased 41.5 percent to 24 days, on average (median of 7 days, down 56.3 percent)
  • Changes in Sales activity varied by market segment
    • Single family sales were up 10.7 percent; condo sales rose 98.3 percent; townhome sales increased 13.6 percent
    • Traditional sales rose 16.6 percent; foreclosure sales were down 35.8 percent; short sales fell 63.6 percent
    • Previously owned sales were up 18.3 percent; new construction sales dropped 5.5 percent

From The Skinny Blog.

Supply Rebounds from 2020 Levels While Demand Continues to Rise

Market times fastest in 14 years amid record home prices in the Twin Cities

(May 17, 2021) – According to new data from the Minneapolis Area REALTORS® and the Saint Paul Area Association of REALTORS®, seller activity in April was up 21.7 percent compared to last year, when new listings dipped partly due to COVID-19. The number of homes that were put on the market in April is comparable to pre-pandemic levels in 2019 and 2018.

The median price of a home in the 16-county Twin Cities metro rose to $337,000, a 10.5 percent increase from last April and a new record high for the region. Even so, half of homes go under contract within 8 days of listing, the fastest time in at least 14 years. This is a clear indication that the metro is still in need of a greater housing supply to keep up with rising demand.

“It’s promising to see improvements in housing supply, but it’s clear that we aren’t out of the woods just yet,” said Todd Walker, President of Minneapolis Area REALTORS®. “In time, more potential sellers will be encouraged to list, enticed by rising prices and more inventory. In the meantime, developers need incentives to expand new inventory, particularly in affordable price ranges.”

Although supply rebounded to that of pre-pandemic levels in April, the increase in demand was even greater. Pending sales are up 34.0 percent from April of last year and exceed 2019 numbers by 8.2 percent. With 5,619 homes for sale, the Twin Cities currently has 1.0 month’s supply of inventory. Typically, 4-6 months is considered a balanced market.

“Buyers still benefit from record low mortgage rates at around 3.0 percent,” according to Tracy Baglio, President of the Saint Paul Area Association of REALTORS®. “Although a limited supply is driving prices higher, low rates are a strong incentive to offer a competitive bid for a home.”

Activity varies by area, price point and property type. Sales of single-family homes were up 32.0 percent in Minneapolis and 14.8 percent in St. Paul, suggesting demand remains strong in the core cities. Across the 16-county Twin Cities region condo sales rose 50.6 percent, outpacing single-family and townhomes. Sales on previously owned homes rose 10.3 percent while new construction rose 2.0 percent. Luxury property sales ($1M+) are up 180.6 percent from last April, 90.6 percent from April 2019.

April 2021 by the numbers compared to a year ago

  • Sellers listed 7,468 properties on the market, a 21.7 percent increase from last April
  • Buyers signed 6,220 purchase agreements, up 33.6 percent (5,088 closed sales, up 8.8 percent)
  • Inventory levels fell 45.8 percent to 5,619 units
  • Month’s Supply of Inventory was down 52.4 percent to 1.0 month (4-6 months is balanced)
  • The Median Sales Price rose 10.5 percent to $337,000
  • Days on Market decreased 34.0 percent to 31 days, on average (median of 8 days, down 52.9 percent)
  • Changes in Sales activity varied by market segment
    • Single family sales were up 3.6 percent; condo sales rose 50.6 percent; townhome sales increased 17.0 percent
    • Traditional sales rose 10.1 percent; foreclosure sales were down 44.1 percent; short sales fell 69.2 percent
    • Previously owned sales were up 10.3 percent; new construction sales climbed 2.0 percent

From The Skinny Blog.

Tight market pushes home prices to new record high in Twin Cities

Inventory hits an 18-year low with buyers competing for fewer listings

(April 16, 2021) – According to new data from the Minneapolis Area REALTORS® and the Saint Paul Area Association of REALTORS®, the median price of a home in the 16-county Twin Cities metro increased 10.3 percent from last March to a record high of $327,500. Prices were driven in part by a lack of supply.

The number of homes for sale at the end of March was half of what was available a year ago. That marks an 18-year low and amounts to 0.9 months of supply. A balanced market typically has 4-6 months of supply. Market times shrank 37.7 percent to 38 days and multiple offers remain commonplace.

“Demand is still growing faster than supply,” according to Tracy Baglio, President of the Saint Paul Area Association of REALTORS®. “With less than one month of supply, buyers must be patient and understand they may lose out on a few bids before an offer is accepted. Be ready to act fast.”

Sellers listed 11.6 percent fewer homes than March 2020, offering little relief to buyers eager for more options. However, sales activity climbed above year-ago levels for the tenth straight month. Buyers continue to be motivated by attractive mortgage rates, a healing labor market and a desire for more space.

“On top of lightning-fast market times, those who choose to sell their home are often rewarded with offers at or above asking price,” said Todd Walker, President of Minneapolis Area REALTORS®. “For buyers, that means writing strong, straightforward offers right away. For sellers, it means their listings will stand out and will likely sell quickly at full price or better.”

Activity varies by area, price point and property type. Sales were up 31.9 percent in Minneapolis and 9.5 percent in St. Paul, suggesting demand remains strong in the core cities. Condos sales rose 31.7 percent, outpacing single-family and townhomes. New construction sales rose 25.5 percent while previously owned homes rose 0.7 percent. Sales of luxury properties ($1M+) have been soaring—up 70.9 percent from last March.

March 2021 by the numbers compared to a year ago

  • Sellers listed 6,587 properties on the market, an 11.6 percent decrease from last March
  • Buyers signed 5,747 purchase agreements, up 12.1 percent (4,342 closed sales, up 2.9 percent)
  • Inventory levels fell 50.7 percent to 4,907 units
  • Months Supply of Inventory was down 52.6 percent to 0.9 months (4-6 months is balanced)
  • The Median Sales Price rose 10.3 percent to $327,500
  • Days on Market decreased 37.7 percent to 38 days, on average (median of 11, down 57.7 percent)
  • Changes in Sales activity varied by market segment
    • Single family sales were down 1.1 percent; condo sales rose 31.7 percent; townhome sales increased 8.7 percent
    • Traditional sales rose 4.5 percent; foreclosure sales were down 42.9 percent; short sales fell 63.2 percent
    • Previously owned sales were up 0.7 percent; new construction sales climbed 25.2 percent

From The Skinny Blog.

Twin Cities housing market still hot, but sales growth flattening

Price growth strong, market times fast, but new listings down and supply levels very low

(March 17, 2021) – According to new data from the Minneapolis Area REALTORS® and the Saint Paul Area Association of REALTORS®, sales activity in the 16-county Twin Cities metro continues to climb above 2020 levels while the number of signed purchase agreements flattened out. Closed sales rose 4.8 percent from last February, which was the highest figure since at least 2003. While new signed purchase agreements were also the strongest since 2005, they were down 0.1 percent from last year, suggesting low supply could be constraining sales.

The number of homes on the market is now at a 20-year low. Sellers listed 12.6 percent fewer homes than February 2020, further shrinking a slim pool of available homes and befuddling home shoppers who continue to show up in record numbers.“We’re seeing lots of factors at play right now,” according to Todd Walker, President of Minneapolis Area REALTORS®. “Buyers are running up against the inventory shortage even as they’re inspired by 50-year low mortgage rates. We’re seeing shifting attitudes around urban living and condos. People are also very encouraged by the progress on the vaccination front.”

The number of homes for sale in February was down 46.3 percent compared to a year ago. That amounts to 0.8 months of supply, while a balanced market has 4-6 months of supply. At 100.1 percent of list price, sellers are still benefiting from historically strong offers, often over asking price and with multiple bids. Homes are selling in record time—half the listings in February sold in under 19.5 days. Home prices rose notably, up 11.5 percent from last February. Historically low rates can partly offset rising prices.

“With so many buyers vying over a shrinking pool of listings, well-priced and well-staged homes don’t spend much time on the market,” said Tracy Baglio, President of the Saint Paul Area Association of REALTORS®. “That means buyers have to come out swinging right out of the gate with their best offer in order to be successful.”

Though pending sales were down 0.1 percent metro-wide, they were up 23.3 percent in Minneapolis and 8.4 percent in St. Paul, indicating buyer interest remains strong in the urban core. Condos also saw the strongest demand growth in both pending and closed sales. New construction sales rose 32.5 percent compared to a 2.6 percent increase for previously owned homes. Sales of luxury properties ($1M+) have been strong—up 53.1 percent from last February.

February 2021 by the numbers compared to a year ago

  • Sellers listed 4,686 properties on the market, a 12.6 percent decrease from last February
  • Buyers signed 4,226 purchase agreements, down 0.1 percent (3,212 closed sales, up 4.8 percent)
  • Inventory levels fell 46.3 percent to 4,670 units
  • Months Supply of Inventory was down 52.9 percent to8 months (4-6 months is balanced)
  • The Median Sales Price rose 11.5 percent to $314,000
  • Days on Market decreased 31.3 percent to 46 days, on average (median of 19.5, down 51.3 percent)
  • Changes in Sales activity varied by market segment
    • Single family sales were up 8.0 percent; condo sales rose 27.9 percent; townhome sales decreased 10.1 percent
    • Traditional sales rose 7.9 percent; foreclosure sales were down 51.3 percent; short sales fell 68.8 percent
    • Previously owned sales were up 2.6 percent; new construction sales climbed 32.5 percent

From The Skinny Blog.

Twin Cities housing market off to strong start for the year

Sales up, price growth strong, market times fast, but new listings down and supply levels very low

(February 17, 2021) – According to new data from the Minneapolis Area REALTORS® and the Saint Paul Area Association of REALTORS®, buyer activity in the 16-county Twin Cities metro continues to climb above 2020 levels. Closed sales rose 14.6 percent from last January and new signed purchase agreements were up 5.6 percent over last year. That marks the strongest January pending sales since 2005 and the highest closed sales figure since at least 2003.

Despite the unyielding commitment from buyers in 2020, there are not enough homes on the market—particularly in the affordable ranges—to satisfy the historic demand. Sellers listed 8.8 percent fewer homes than January 2020, further shrinking an already historically low inventory of available homes.

“Last year was incredibly strong and so far 2021 is keeping up the pace,” according to Todd Walker, President of Minneapolis Area REALTORS®. “Rates are as attractive as they’ve ever been and the demand is persistent, but the challenge is still the lack of supply.”

The number of homes for sale in January was down 42.6 percent compared to a year ago. That amounts to 0.9 months of supply, while a balanced market has 4-6 months of supply. This dynamic has given rise to four other trends: sellers are getting historically strong offers, homes are selling in record time, multiple offers and competitive bidding have become commonplace and home prices are rising quickly relative to incomes.

“There are many motivated buyers out there but not nearly enough homes for them on the market,” said Tracy Baglio, President of the Saint Paul Area Association of REALTORS®. “Proper pricing is still critical, but sellers are accepting offers that are at or very close to list price, occasionally above it in the first-time buyer segments.”

Pending sales were up 39.4 percent in Minneapolis and 14.0 percent in St. Paul, indicating buyer interest remains quite strong in the core cities. Perhaps surprisingly, condos saw the strongest sales growth followed by single family and then townhomes. New construction sales rose 12.2 percent compared to a 16.0 percent increase for previously owned homes. Sales of luxury properties ($1M+) have been rallying—up 75.0 percent from last January.

For more information on weekly and monthly housing numbers visit www.mplsrealtor.com or www.spaar.com

January 2021 by the numbers compared to a year ago

  • Sellers listed 3,989 properties on the market, an 8.8 percent increase from last January
  • Buyers signed 3,519 purchase agreements, up 5.6 percent (3,335 closed sales, up 14.6 percent)
  • Inventory levels fell 42.6 percent to 4,823 units
  • Months Supply of Inventory was down 47.1 percent to9 months (5-6 months is balanced)
  • The Median Sales Price rose 11.5 percent to $301,000
  • Days on Market decreased 37.3 percent to 42 days, on average (median of 22, down 50.0 percent)
  • Changes in Sales activity varied by market segment
    • Single family sales were up 16.3 percent; condo sales rose 18.3 percent; townhome sales increased 7.8 percent
    • Traditional sales rose 16.2 percent; foreclosure sales were down 35.1 percent; short sales fell 44.4 percent
    • Previously owned sales were up 16.0 percent; new construction sales climbed 12.2 percent

From The Skinny Blog.