Weekly Market Report

For Week Ending March 21, 2015

An increase in new home sales are in the spotlight, thanks to some recent figures by the Commerce Department, but one should be careful not to speculate too much about sales outpacing predicted numbers from the beginning of the year. Small sample sizes, seasonal adjustments and poor geographic weighting can have undesirable consequences on the reliability of national figures. This is why locally grown MLS data is often the best source for quality market-informed nourishment.

In the Twin Cities region, for the week ending March 21:

  • New Listings increased 22.1% to 1,821
  • Pending Sales increased 27.1% to 1,252
  • Inventory increased 1.7% to 13,869

For the month of February:

  • Median Sales Price increased 9.3% to $200,000
  • Days on Market increased 7.1% to 106
  • Percent of Original List Price Received increased 0.7% to 94.2%
  • Months Supply of Inventory increased 3.3% to 3.1

All comparisons are to 2014

Click here for the full Weekly Market Activity Report. From The Skinny Blog.

Weekly Market Report

For Week Ending March 14, 2015

Have rents gone up enough to get renters to lean toward homeownership again? That’s the question of the moment. With mortgage rates remaining low, the time may be ripe for renters to invest in something beyond a 12-month lease as rental affordability is beginning to border on unaffordability.

In the Twin Cities region, for the week ending March 14:

  • New Listings increased 20.6% to 1,765
  • Pending Sales increased 14.3% to 1,040
  • Inventory increased 1.4% to 13,523

For the month of February:

  • Median Sales Price increased 9.3% to $200,000
  • Days on Market increased 7.1% to 106
  • Percent of Original List Price Received increased 0.7% to 94.2%
  • Months Supply of Inventory increased 3.3% to 3.1

All comparisons are to 2014

Click here for the full Weekly Market Activity Report. From The Skinny Blog.

2015 Foreclosure & Short Sale Update

By David Arbit on Friday, March 20th, 2015

As many have noted, one of the biggest changes to the Twin Cities and national housing markets was the sudden influx and subsequent absorption of distressed properties. “Distressed” simply refers to any new listing, active listing or closed sale where the lender either owns the property (foreclosure) or the property was sold for less than the outstanding amount owed on the mortgage (short sale).

As both the public and private sectors began laying off workers in conjunction with other cost-cutting efforts around 2008 and 2009, many households begrudgingly became single-wage households or worse. That generated a notable increase in mortgage delinquencies, which led to banks repossessing homes and selling them short.

As financial institutions began listing these distressed homes for sale, buyers began taking advantage of the great deals. Many of those buyers were—and, to a lesser extent, are—investors, though some were ordinary families and individuals taking advantage of a historic opportunity.

2015-03-20-14_51_47-Greenshot-310x238
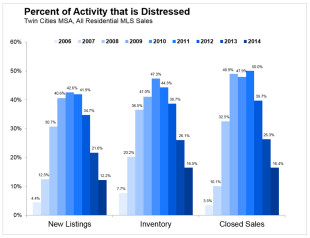
Due to a variety of factors ranging from rising home prices to the longest stretch of private job growth in decades, the share of market activity that can be categorized as either foreclosure or short sale is easing. In 2011, foreclosures and short sales together made up exactly 50.0% of all closed sales in the 13-county metropolitan area even though they comprised less than 42.0% of all new listings. This means they made up a larger share of the sales pie than the listing pie, signaling robust demand for these bargain properties.

Fast forward to 2014. Last year, only 12.2% of all new listings were in distress while the figure was 16.4% for closed sales. Those numbers mark a dramatic decrease in the prevalence of distressed listing and sales activity in the Twin Cities region. Most of the active listings (inventory) in this segment has been absorbed off the market and institutions are listing fewer and fewer of them.

So why should you care about any of this? Fair question. After all, foreclosure market share doesn’t exactly make for exciting backyard barbeque conversations, unless you’re a housing researcher (I swear I have friends that aren’t computers). But who doesn’t love talking about home prices? There never seems to be a shortage of speculation regarding where home prices might be heading next. Some think we’re in another bubble, others think we’re returning to historically typical levels of stable price appreciation.

Since prices seem to be the preferred market barometer of choice for most consumers (anyone heard of an absorption rate or even price per square foot?), it stands to reason that many consumers and real estate professionals alike would have a vested interest in better understanding what’s affecting home prices.

2015-03-20-14_50_07-Greenshot-310x215
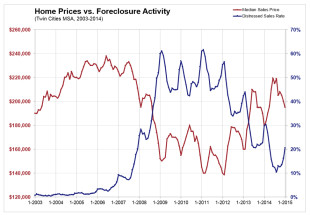
By far the biggest factor affecting home prices is the percentage of all sales that are distressed—i.e. the distressed sales rate. Coincidentally, that is exactly what’s shown in the blue trendline to the left. Also plotted here is the median sales price for the metro. This chart shows the nature and strength of the relationship between the distressed market share and home prices.

2015-03-20-14_37_11-Greenshot-702x589
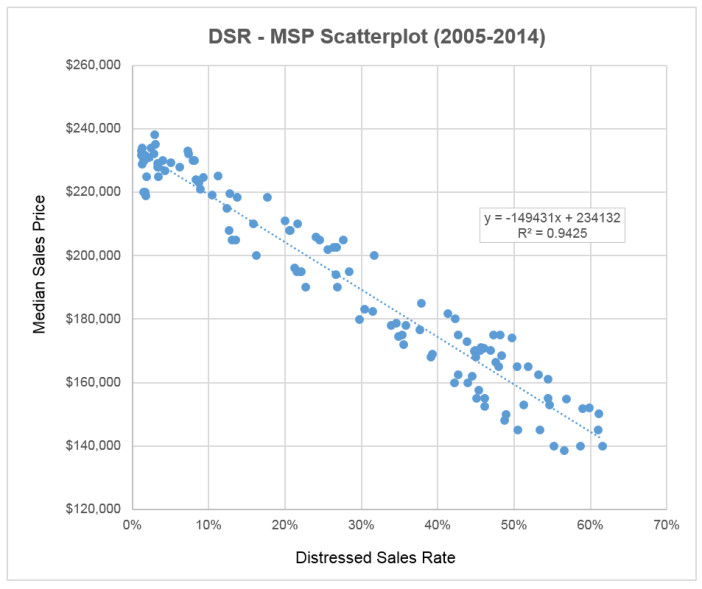
The nature of the relationship is an inverse one and the magnitude is quite strong. In other words, when distressed market share increases, home prices tend to fall and vice versa. And you can just about bet the farm on that one. For those who are wondering, the R-square between these two variables is 0.9425 and the relationship is statistically significant. This means that about 94.25% of the variation in home prices can be attributed to variability in distressed market share. If you had a 94.25% chance of success in betting big on a single stock or a poker hand or your favorite Canterbury horse, wouldn’t you?

Gazing into the proverbial crystal ball, expect distressed market activity to fall below 10.0% for closed sales and likely below 8.0% for new listings. But those are just prognostications. Ultimately, if you’re wondering where home prices are heading next, simply follow the percentage of all closed sales that are either foreclosures or short sales.

Wasn’t that fun? Until next time!

From The Skinny Blog.

Weekly Market Report

For Week Ending March 7, 2015

Many residential real estate markets across the country and locally are in a fairly stable state of balance, causing most stories about housing to be conservative in nature with not much change to report. As the weather continues to warm up across the country, more sales are expected.

In the Twin Cities region, for the week ending March 7:

  • New Listings increased 31.7% to 1,915
  • Pending Sales increased 34.1% to 1,098
  • Inventory increased 0.3% to 13,018

For the month of February:

  • Median Sales Price increased 9.3% to $200,000
  • Days on Market increased 7.1% to 106
  • Percent of Original List Price Received increased 0.7% to 94.2%
  • Months Supply of Inventory increased 3.3% to 3.1

All comparisons are to 2014

Click here for the full Weekly Market Activity Report. From The Skinny Blog.

After three full years of price gains, recovery shows renewed vigor

By Aubray Erhardt on Thursday, March 12th, 2015

The Twin Cities housing market showed refreshed signs of strength last month, partly in anticipation of what looks to be a promising spring market as well as favorable interest rates. Buyer and seller activity surged in February. New listings increased 23.2 percent to 5,690 during the month, the largest year-over-year increase since July 2013. Pending sales—or a count of the number of signed purchase agreements—increased 21.8 percent to 3,834, the largest year-over-year increase since October 2012. With only two months in the books, already buyers and sellers have shown more activity than they did for any one month of 2014. Inventory levels were still lower, down 2.0 percent to 12,700 homes, but that trend is unlikely to continue.

The median sales price rose 10.4 percent to $202,000, the strongest gain since last February. This increase officially marks 36 consecutive months or three full years of year-over-year median price gains. Price per square foot—which adjusts for the square footage of homes selling—rose 6.6 percent to $120. Absorption rates remained flat at 3.0 months, and still technically favor sellers. That said, today’s market environment is slightly less competitive than in 2013. Days on market rose 7.1 percent to 106 days.

The market share of foreclosures and short sales continued to shrink on both the supply and demand side. Traditional new listings rose a substantial 33.8 percent, while foreclosure and short sale new listings each fell between 25 and 30 percent. Traditional pending sales rose a massive 41.5 percent, while foreclosure and short sale pendings each fell between 32 and 36 percent. This dynamic has partly enabled three consecutive years of rising prices.

“If February is any indication, this spring is shaping up to be everything that spring markets should be,” said Mike Hoffman, President of the Minneapolis Area Association of REALTORS® (MAAR). “The fact that we’re seeing large gains in buyer and seller activity mostly driven by traditional properties bodes quite well for consumer confidence at a critical time.”

The finance environment remains enormously attractive. Mortgage rates continue to hover between 3.5 and 4.0 percent. The long-term average is roughly 7.0 percent. This appealing affordability picture can potentially offset recent home price increases and also encourages renters to consider homeownership. The Twin Cities housing affordability index of 210 has actually increased 2.4 percent from last February.

A highly diverse and robust economy has served the Twin Cities housing market well throughout various cycles. According to the Bureau of Labor Statistics, the Twin Cities has the lowest unemployment rate of any major metro in the nation at 3.3 percent. Recently, national private job creation has accelerated toward 300,000 jobs per month.

“Even though every area and market segment is unique, what we’re seeing in the numbers is definitely reflected out in the community,” said Judy Shields, MAAR President-Elect. “After being cooped up all winter, people are eager to get out there and find their dream home.”

From The Skinny Blog.

Weekly Market Report

For Week Ending February 28, 2015

Across the country, some Fortune 500 companies have been raising their
minimum wage. How does this correlate to the housing industry? Mo’ money =
mo’ house-buying powerz. Coupled with the dismantled idea that aging
millennials want to remain at home forever (because, come on, really?), the
housing market is making inroads into two factors that have plagued the buyer
market in recent years. Warmer weather sure can’t hurt either.

In the Twin Cities region, for the week ending February 28:

  • New Listings increased 23.0% to 1,532
  • Pending Sales increased 21.0% to 1,076
  • Inventory decreased 2.2% to 12,690

For the month of February:

  • Median Sales Price increased 10.4% to $202,000
  • Days on Market increased 7.1% to 106
  • Percent of Original List Price Received increased 0.6% to 94.1%
  • Months Supply of Inventory remained flat at 3.0

All comparisons are to 2014

Click here for the full Weekly Market Activity Report. From The Skinny Blog.

Weekly Market Report

For Week Ending February 21, 2015

Rumors that Fannie Mae and Freddie Mac could one day be a thing of the past have people wondering about the future of the 30-year fixed-rate mortgage. But let’s not sound the alarm just yet. A drastic change to lending’s gold standard is certainly not on the immediate horizon. Meanwhile, Federal Reserve Chair Janet Yellen seems to have no immediate interest in raising interest rates for the first time since 2006. The economy remains stable for the time being, which should keep housing rolling through the short-named months.

In the Twin Cities region, for the week ending February 21:

  • New Listings increased 29.8% to 1,365
  • Pending Sales increased 36.4% to 981
  • Inventory decreased 3.0% to 12,570

For the month of January:

  • Median Sales Price increased 8.5% to $195,000
  • Days on Market increased 7.5% to 100
  • Percent of Original List Price Received increased 0.2% to 93.7%
  • Months Supply of Inventory increased 3.4% to 3.0

All comparisons are to 2014

Click here for the full Weekly Market Activity Report. From The Skinny Blog.