Weekly Market Report

For Week Ending October 22, 2016

Even though there are still more than two months remaining on the year, there is little to suggest that the prevailing trends of 2016 will suddenly change. If all holds firm, inventory will trend lower, prices will trend higher and sales will show that demand remains strong, despite having fewer homes to choose from.

In the Twin Cities region, for the week ending October 22:

  • New Listings decreased 4.7% to 1,174
  • Pending Sales increased 8.2% to 1,001
  • Inventory decreased 15.9% to 13,632

For the month of September:

  • Median Sales Price increased 3.6% to $230,000
  • Days on Market decreased 13.8% to 56
  • Percent of Original List Price Received increased 0.9% to 97.5%
  • Months Supply of Inventory decreased 20.0% to 2.8

All comparisons are to 2015

Click here for the full Weekly Market Activity Report. From The Skinny Blog.

Weekly Market Report

For Week Ending October 15, 2016

Housing starts may have fallen for the second month in a row, but the cause appears to be an abnormally large decline in the multifamily category. An increase in single-family starts and building permits is a better indicator of a market reacting positively to the prevailing inventory struggle.

In the Twin Cities region, for the week ending October 15:

  • New Listings increased 5.0% to 1,364
  • Pending Sales decreased 0.1% to 994
  • Inventory decreased 16.2% to 13,795

For the month of September:

  • Median Sales Price increased 3.6% to $230,000
  • Days on Market decreased 13.8% to 56
  • Percent of Original List Price Received increased 0.9% to 97.5%
  • Months Supply of Inventory decreased 20.0% to 2.8

All comparisons are to 2015

Click here for the full Weekly Market Activity Report. From The Skinny Blog.

Weekly Market Report

For Week Ending October 8, 2016

Cooling weather and recent interest rate hikes have fewer first-time buyers shopping for homes thus far this fall, just as many existing homeowners are cozying up to the idea of remaining in their current homes a little bit longer. With fewer home buyers and homes for sale, we may see sales and sales prices start to mellow, or it could mean that the more serious buyers and sellers will simply have less competition.

In the Twin Cities region, for the week ending October 8:

  • New Listings decreased 4.1% to 1,395
  • Pending Sales decreased 6.5% to 980
  • Inventory decreased 16.5% to 13,832

For the month of September:

  • Median Sales Price increased 3.6% to $230,000
  • Days on Market decreased 13.8% to 56
  • Percent of Original List Price Received increased 0.9% to 97.5%
  • Months Supply of Inventory decreased 20.0% to 2.8

All comparisons are to 2015

Click here for the full Weekly Market Activity Report. From The Skinny Blog.

Prices Firm And Signs Of Seller Confidence Moving Into Fall

By Erin Milburn on Friday, October 14th, 2016

Seller activity increased 5.6 percent since last September, the largest increase all year. Sellers introduced 6,727 new listings to the marketplace. Closed sales increased 5.7 percent while pending purchase activity was flat. That closed sales figure is on par with 2005 levels. Although home prices have reached their seasonal peak for 2016, the median sales price increased 3.6 percent from last September. The midpoint where half the homes sold for more and half the homes sold for less was to $230,000. As has been the case for some time, buyers are greeted with a shrinking number of options. Inventory levels fell 16.1 percent to 13,918 active properties. Inventory constraints haven’t slowed down buyers yet, but additional listings are needed to ease the shortage—especially at entry-level price points.

Multiple bids on attractive listings are common in low inventory environments, and homes tend to sell quickly. Days on market until sale fell 13.8 percent to 56 days. That’s only two days away from the record in 2007. The average percent of original list price received at sale was 97.5 percent, 0.9 percent higher than last year and the highest figure for any September since 2005. Months supply of inventory fell 20.0 percent to 2.8 months—the lowest September figure on record since the beginning of 2003. This indicator measures the balance between supply and demand in the marketplace. Generally, five to six months of supply is considered a balanced market.

“This market doesn’t seem to be slowing down one bit,” said Judy Shields, Minneapolis Area Association of REALTORS® (MAAR) President. “Even though buyers are active, the market can still feel uneven in some ways. Homes in the $200,000 to $300,000 range are seeing the strongest interest.”

PendingSales_2016-09-702x212
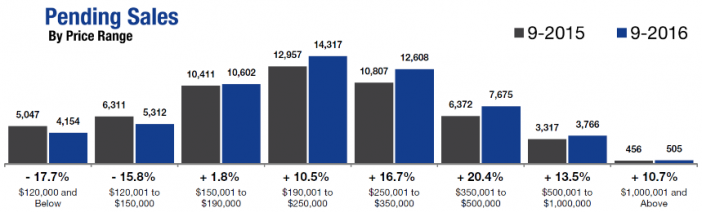
Indeed, the strongest sales activity over the last 12 months is in the $190,000 to $250,000 range, followed by the $250,000 to $350,000 range. Although single family sales dominate the Twin Cities market by number, condo and townhome sales witnessed the largest year-over-year sales increase. Similarly, although previously-owned properties make up the largest share of sales, newly constructed properties had a stronger year-over-year gain.

A strong Twin Cities labor market has also helped promote housing recovery. The most recent national unemployment rate is 5.0 percent, though it’s a healthier 3.6 percent locally. The Minneapolis-St. Paul-Bloomington metropolitan area has among the lowest unemployment rate of any major metro area.

Locally, the 30-year fixed mortgage rate stands at 3.49 percent compared to a long-term average of about 8.0 percent. Rates are now at their lowest level in three years. Marginally higher rates were widely expected in 2016, but the Federal Reserve hasn’t moved rates since last December. Barring any economic or political surprises, the Fed will likely raise rates this December.

“Despite some low inventory challenges, this market is on solid footing. In some ways, we’re in a classic chicken or egg dilemma,” said Cotty Lowry, MAAR President-Elect. “Which comes first? More listing activity or more inventory? Today’s sellers are skittish because it’s tough to find their next place. To break this cycle, sellers will need to list in higher numbers and move up the housing chain.”

All information is according to the Minneapolis Area Association of REALTORS® (MAAR) based on data from NorthstarMLS. MAAR is the leading regional advocate and provider of information services and research on the real estate industry for brokers, real estate professionals and the public. MAAR serves the Twin Cities 13-county metro area and western Wisconsin.
From The Skinny Blog.

Weekly Market Report

For Week Ending October 1, 2016

As the struggle to maintain adequate inventory levels continues in much of the country, a number of influences have been named as factors in the housing shortage. One probable cause is the large decline in negative equity on homes that were bought before the recession. As prices continue to go up, those homes are either placed on the market and snatched up quickly or they may have even risen to a less affordable price for today’s home shoppers.

In the Twin Cities region, for the week ending October 1:

  • New Listings increased 3.9% to 1,429
  • Pending Sales decreased 4.0% to 1,066
  • Inventory decreased 16.5% to 14,125

For the month of September:

  • Median Sales Price increased 3.6% to $230,000
  • Days on Market decreased 13.8% to 56
  • Percent of Original List Price Received increased 0.9% to 97.5%
  • Months Supply of Inventory decreased 20.0% to 2.8

All comparisons are to 2015

Click here for the full Weekly Market Activity Report. From The Skinny Blog.

Weekly Market Report

For Week Ending September 24, 2016

An increase in builder confidence could indicate an increase in construction starts in the near future, which would be great news in a time of continued supply constriction. As rents and sales prices throughout the country continue to rise, adding purchasable housing to the market mix over more rentals would help alleviate the inadequate inventory situation and potentially ease affordability for prospective buyers.

In the Twin Cities region, for the week ending September 24:

  • New Listings increased 1.7% to 1,421
  • Pending Sales increased 2.2% to 1,044
  • Inventory decreased 16.5% to 14,244

For the month of August:

  • Median Sales Price increased 5.6% to $237,500
  • Days on Market decreased 14.1% to 55
  • Percent of Original List Price Received increased 0.8% to 97.9%
  • Months Supply of Inventory decreased 21.6% to 2.9

All comparisons are to 2015

Click here for the full Weekly Market Activity Report. From The Skinny Blog.