
Where has the Twin Cities real estate market been and where is it heading? This monthly summary provides an overview of current trends and projections for future activity.
Monthly Archives: May 2015
Weekly Market Report

For Week Ending May 16, 2015
The song remains the same. While new listings and sales increase, inventory is not always able to keep pace. Demand is high as mortgage rates remain low. There are homes to choose from, for sure, but there should be more if balance is expected to be more than novelty. New construction is occurring, but the notable projects are just as liable to be rental as for sale. The dynamics of residential real estate are ever shifting, churning.
In the Twin Cities region, for the week ending May 16:
- New Listings increased 7.4% to 2,187
- Pending Sales increased 29.4% to 1,488
- Inventory decreased 2.9% to 15,748
For the month of April:
- Median Sales Price increased 9.7% to $215,000
- Days on Market decreased 4.5% to 85
- Percent of Original List Price Received increased 1.1% to 97.0%
- Months Supply of Inventory decreased 2.8% to 3.5
All comparisons are to 2014
Click here for the full Weekly Market Activity Report. From The Skinny Blog.
Weekly Market Report
For Week Ending May 9, 2015
As we press through May, the residential real estate market is really hitting its paces. Sales activity has been plentiful and REALTORS® are busier than ever. The Bureau of Labor Statistics recently released April numbers, and they are still quite positive. The nation added 223,000 jobs and the national unemployment rate dropped to 5.4%. The need for more inventory is an ongoing issue, but not one that thwarts optimism in the marketplace.
In the Twin Cities region, for the week ending May 9:
- New Listings increased 7.1% to 2,117
- Pending Sales increased 24.0% to 1,526
- Inventory decreased 1.8% to 15,518
For the month of April:
- Median Sales Price increased 9.7% to $215,000
- Days on Market decreased 4.5% to 85
- Percent of Original List Price Received increased 1.1% to 97.0%
- Months Supply of Inventory decreased 2.8% to 3.5
All comparisons are to 2014
Click here for the full Weekly Market Activity Report. From The Skinny Blog.
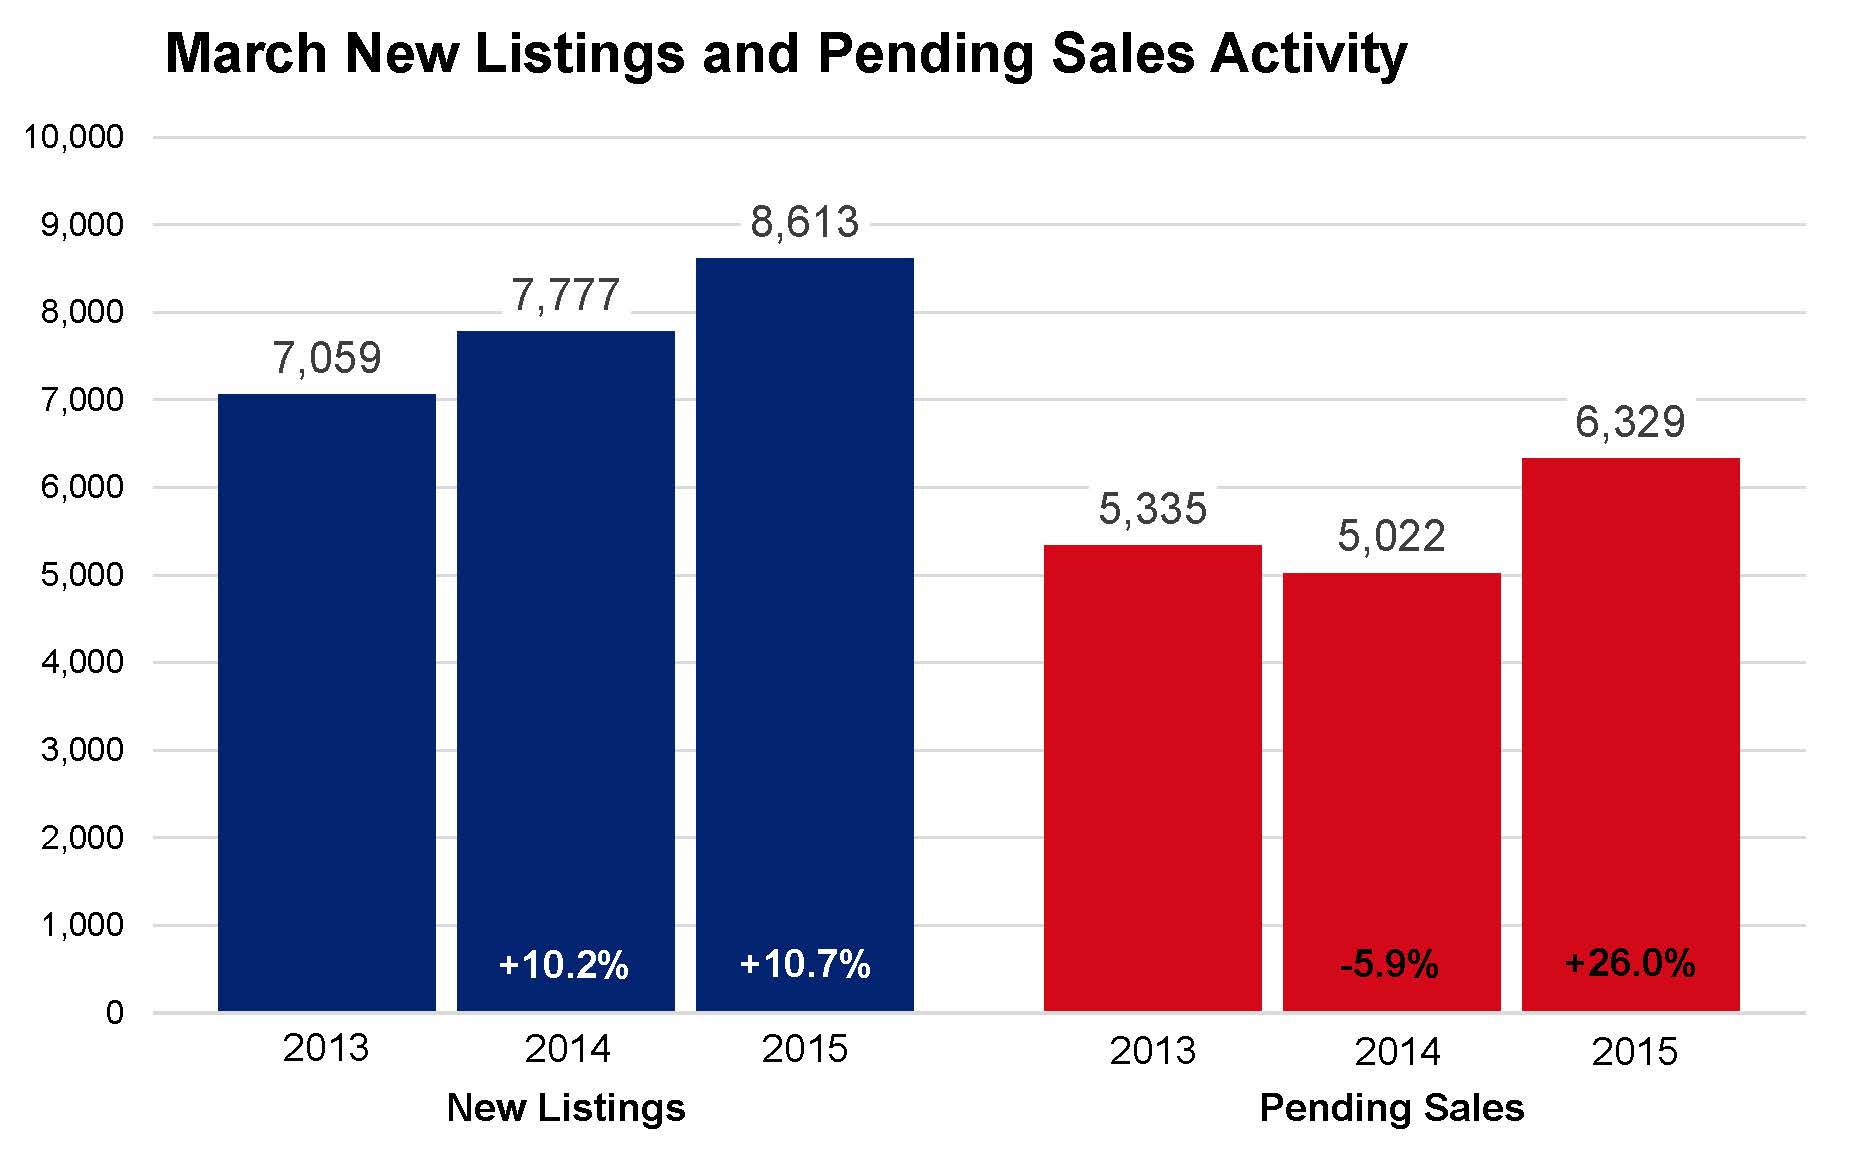
April Pending Sales Highest for Any Month Since June 2005
By Aubray Erhardt on Tuesday, May 12th, 2015
The number of signed purchase agreements in the 13-county Twin Cities region reached a 10-year high for the month of April. The figure came up just shy of reaching a 10-year record high for any month. Buyers wrote 6,329 offers to purchase homes, a 26.0 percent increase from last April and the most for any month since June 2005. New listings also rose as sellers continued to regain confidence. The number of new listings increased 10.7 percent to 8,613 during the month. That’s the highest number of new listings for any month since the home buyer tax credit period of April 2010.
The median sales price sustained its upward trajectory, increasing 10.0 percent to $215,600. The median home price has now seen 38 months of year-over-year increases. Price per square foot—which accounts for the rising square footage of homes selling—rose a more modest 3.0 percent to $124. Months supply of inventory fell 5.6 percent to 3.4 months, and still points to an overall seller’s market. Days on market decreased for the first time this year. Those selling their homes are waiting an average of 85 days before accepting an offer.
“Overall, buyers are truly out in force this spring,” said Mike Hoffman, President of the Minneapolis Area Association of REALTORS® (MAAR). “Climbing rents, consistent job growth and finally some beginning signs of wage growth are all encouraging Twin Citizens to invest in homeownership.”
As a result of the strong demand, inventory shortages in the most popular price ranges and neighborhoods can still be challenging for many buyers. Over the last 12 months, inventory levels fell 1.1 percent in the $100,000 to $249,999 range but rose 22.2 percent in the $250,000 to $499,000 range. The number of active listings for homes priced above $500,000 rose 21.4 percent.
Among the different property types, inventory levels fell 4.6 percent for condos and 0.9 percent for townhomes, but rose 10.0 percent for single-family properties. The number of homes on the market rose 6.2 percent over the past 12 months for previously owned homes, but the figure increased 19.3 percent for new construction homes.
The finance environment remains favorable. Mortgage rates are approximately 3.9 percent, compared with a long-term average of 7.0 percent. The Twin Cities housing affordability index actually increased since this time last year.
A diverse and growing regional economy has served the Twin Cities housing market well throughout the years. According to the Bureau of Labor Statistics, the Twin Cities has the fifth lowest unemployment rates of any major metropolitan area in the nation at 4.0 percent. Forbes ranked Minnesota as one of the top 10 best states for business, seventh in economic climate and second in quality of life.
“The numbers combined with the sense of urgency really paint a clear picture,” said Judy Shields, MAAR President-Elect. “Buyers are quite motivated, hoping to get in before rates rise, though both buyers and sellers stand to benefit from the current market environment.” From The Skinny Blog.
Weekly Market Report
For Week Ending May 2, 2015
Through research conducted by the National Association of REALTORS® on the 100 largest housing markets in the nation, it was revealed that 93 out of 100 had uneven wealth ratios and declining homeownership between 2010 and 2013. Homeownership has dropped as slow wage growth, low inventory and tough mortgage standards have become the norm. Activity is spring fresh and exciting at the moment, but it is important to be mindful of the long game.
In the Twin Cities region, for the week ending May 2:
- New Listings increased 10.5% to 2,050
- Pending Sales increased 26.0% to 1,512
- Inventory decreased 1.3% to 15,298
For the month of April:
- Median Sales Price increased 10.2% to $216,000
- Days on Market decreased 4.5% to 85
- Percent of Original List Price Received increased 1.1% to 97.0%
- Months Supply of Inventory decreased 2.8% to 3.5
All comparisons are to 2014
Click here for the full Weekly Market Activity Report. From The Skinny Blog.
Weekly Market Report
For Week Ending April 25, 2015
New listings are on the ups, and buyers seem poised to move on the most desirable new properties in a hurry. Tales of one-day and even same-day purchase offers are being shared over coffee, lunch and happy hour, generally bringing the total days on market average down as the joy index rises.
In the Twin Cities region, for the week ending April 25:
- New Listings increased 3.5% to 1,971
- Pending Sales increased 38.7% to 1,625
- Inventory increased 0.4% to 15,178
For the month of March:
- Median Sales Price increased 10.5% to $210,000
- Days on Market increased 7.4% to 102
- Percent of Original List Price Received increased 0.8% to 95.9%
- Months Supply of Inventory increased 3.0% to 3.4
All comparisons are to 2014
Click here for the full Weekly Market Activity Report. From The Skinny Blog.