Weekly Market Report

For Week Ending March 18, 2023

More than a decade of underbuilding has resulted in a shortage of 6.5 million single-family homes, as new-home construction continues to lag population growth. According to a new report from Realtor.com, 15.6 million new households were formed between 2012 and 2022, while only 9.03 million new single-family homes were completed. However, the report acknowledges that if multi-family starts are included, which represented 35% of all housing starts in 2022, the current supply deficit falls to 2.3 million homes.

IN THE TWIN CITIES REGION, FOR THE WEEK ENDING MARCH 18:

  • New Listings decreased 29.9% to 1,006
  • Pending Sales decreased 27.7% to 850
  • Inventory increased 10.8% to 5,743

FOR THE MONTH OF FEBRUARY:

  • Median Sales Price increased 0.6% to $342,000
  • Days on Market increased 38.6% to 61
  • Percent of Original List Price Received decreased 3.6% to 97.2%
  • Months Supply of Homes For Sale increased 44.4% to 1.3

All comparisons are to 2022

Click here for the full Weekly Market Activity Report. From MAAR Market Data News.

February Monthly Skinny Video

Mortgage interest rates have dipped slightly from their peak last fall, leading pending sales to increase 8.1% month-to-month as of last measure, but affordability constraints continue to limit homebuyer activity overall, with existing-home sales declining for the twelfth consecutive month, according to the National Association of Realtors® (NAR).

Weekly Market Report

For Week Ending March 11, 2023

The slower pace of home sales has helped housing supply increase at a record pace nationwide, with inventory climbing 67.8% year-over-year in February, according to Realtor.com’s latest Monthly Housing Market Trends report. Inventory was up in 49 out of 50 of the largest US metros, driven largely by increased time on market and a decrease in buyer demand due to elevated borrowing costs. February marks the 6th consecutive month the supply of homes increased, although inventory remains down compared to pre-pandemic levels.

IN THE TWIN CITIES REGION, FOR THE WEEK ENDING MARCH 11:

  • New Listings decreased 25.8% to 1,011
  • Pending Sales decreased 31.7% to 804
  • Inventory increased 10.4% to 5,649

FOR THE MONTH OF FEBRUARY:

  • Median Sales Price increased 0.5% to $341,850
  • Days on Market increased 38.6% to 61
  • Percent of Original List Price Received decreased 3.6% to 97.2%
  • Months Supply of Homes For Sale increased 44.4% to 1.3

All comparisons are to 2022

Click here for the full Weekly Market Activity Report. From MAAR Market Data News.

Twin Cities Home Prices Flattening Out with Latest Rate Spike

  • Median sales price of Twin Cities homes rose 0.6 percent to just under $342,000
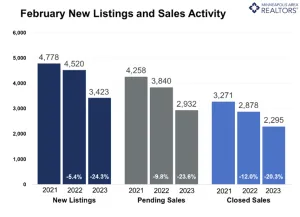
  • Buyer activity down 23.6 percent with 2,932 pending sales
  • Sellers listed 24.3 percent fewer homes compared to last February

(March 15, 2022) – According to new data from Minneapolis Area REALTORS® and the Saint Paul Area Association of REALTORS®, the median sales price across the Twin Cities grew 0.6 percent to $342,000. Home price growth has flattened out in the face of higher mortgage rates and deteriorating affordability.

Inventory & Home Prices

Although home prices have flattened out, they were still up slightly year-over-year. It’s possible that home prices soften in the coming months if rates rise further or remain sticky. “People should understand that their home hasn’t necessarily lost value simply because the median price falls,” according to Jerry Moscowitz, President of Minneapolis Area REALTORS®. “The median reflects the mid-point where half the homes sell for more and half for less. If there are more luxury properties, new homes or condos selling, that all impacts prices. So does supply and demand.”

Home buyers have been able to purchase bigger, nicer homes when rates were low because the payment allowed them to. That’s changed. Buyers are more willing to look at other property types, smaller homes and in different areas. That doesn’t mean every home out there is worth any less, but likely means those that do sell may have to be flexible and make some concessions.

Given the pullback in sales, we had 7.1 percent more homes on the market at month-end. Before buyers celebrate more options, the metro only has 1.3 month’s supply of inventory. Typically 4-6 months of supply are needed to reach a balanced market. Since both sales and listings have come down in tandem, the market remains fairly thin. That said, sellers don’t quite have the leverage they’ve enjoyed of late.

Sales & Listings

The Federal Reserve’s rate hikes have taken a toll on home sales. As some buyers were sidelined by higher mortgage rates and increased monthly payments, resulting in 2,932 purchase agreements, 23.6 percent below last year. The decline in pending sales is the second smallest since July 2022—behind January of this year and hinting that perhaps the declines are easing. “We’re in a place where buyers have more leverage but lowball offers likely won’t be successful,” said Brianne Lawrence, President of the Saint Paul Area Association of REALTORS®. “That means buyers are writing offers at or slightly below list price and they can take more time to decide on what works best for them.”

Sellers brought 3,423 homes on the market in February, 24.3 percent fewer listings than last year. Half of all sellers sold their listings for over 98.2 percent of list price compared to 100.0 percent last year. And they accepted those offers after an average of 62 days on market compared to 44 last year.

Location & Property Type

Market activity varies by area, price point and property type. New home sales fell 9.2 percent while existing home sales were down 25.7 percent. Single family sales fell 26.2 percent, condo sales declined 36.0 percent and townhome sales were down 6.4 percent. Sales in Minneapolis decreased 35.0 percent while Saint Paul sales fell 33.7 percent. Cities like Corcoran, Buffalo, Watertown and St. Francis saw the largest sales gains while Hudson, Forest Lake and Carver all had notably lower demand than last year.

February 2022 Housing Takeaways (compared to a year ago)

  • Sellers listed 3,423 properties on the market, a 24.3 percent decrease from last February
  • Buyers signed 2,932 purchase agreements, down 23.6 percent (2,295 closed sales, down 20.3 percent)
  • Inventory levels grew 7.1 percent to 5,327 units
  • Month’s Supply of Inventory rose 44.4 percent to 1.3 months (4-6 months is balanced)
  • The Median Sales Price rose 0.6 percent to $342,000
  • Days on Market rose 40.9 percent to 62 days, on average (median of 44 days, up 131.6 percent)
  • Changes in Sales activity varied by market segment
    • Single family sales decreased 26.2 percent; Condo sales were down 36.0 percent & townhouse sales fell 6.4 percent
    • Traditional sales declined 23.9 percent; foreclosure sales rose 10.3 percent; short sales increased by 8 units
    • Previously owned sales decreased 25.7 percent; new construction sales declined 9.2 percent


    From The Skinny Blog.

Weekly Market Report

For Week Ending March 4, 2023

According to recent data from Black Knight, more than 40% of US mortgages originated in 2020 – 2021, with almost 25% of all current home loans originating in 2021, when the pandemic helped mortgage rates tumble to historic lows. What’s more, nearly 65% of mortgages are at rates of 4% or below, offering little incentive for many current homeowners to sell their homes now that borrowing costs are significantly higher.

IN THE TWIN CITIES REGION, FOR THE WEEK ENDING MARCH 4:

  • New Listings decreased 23.2% to 1,126
  • Pending Sales decreased 36.1% to 751
  • Inventory increased 11.3% to 5,539

FOR THE MONTH OF JANUARY:

  • Median Sales Price increased 2.7% to $342,000
  • Days on Market increased 46.3% to 60
  • Percent of Original List Price Received decreased 3.6% to 96.0%
  • Months Supply of Homes For Sale increased 55.6% to 1.4

All comparisons are to 2022

Click here for the full Weekly Market Activity Report. From MAAR Market Data News.

Weekly Market Report

For Week Ending February 25, 2023

According to a recent National Association of Home Builders/Wells Fargo Housing Market Index (HMI) survey, building material prices were the most significant issue for US homebuilders last year, with 96% of builders reporting that building material prices were a problem. Availability of building materials and cost and availability of labor also ranked among the largest problems builders faced in 2022, along with rising inflation and higher interest rates, both of which remain top concerns this year for the majority of builders surveyed.

IN THE TWIN CITIES REGION, FOR THE WEEK ENDING FEBRUARY 25:

  • New Listings decreased 35.3% to 743
  • Pending Sales decreased 23.5% to 744
  • Inventory increased 15.1% to 5,735

FOR THE MONTH OF JANUARY:

  • Median Sales Price increased 2.7% to $342,000
  • Days on Market increased 46.3% to 60
  • Percent of Original List Price Received decreased 3.6% to 96.0%
  • Months Supply of Homes For Sale increased 55.6% to 1.4

All comparisons are to 2022

Click here for the full Weekly Market Activity Report. From MAAR Market Data News.