Weekly Market Report

For Week Ending November 21, 2015

We’re still looking at better-than-expected new listing and sales activity in most markets across the country, while overall inventory and months’ supply of inventory remains down. While the addition of new listings and an increase in sales activity will not always be up in year-over-year comparisons on a weekly basis, the trend has remained rather optimistic into the year-end months that typically see a slowness in residential real estate activity. Anecdotally, this feels like a response to the inevitable rate hike that is coming before 2015 is complete.

In the Twin Cities region, for the week ending November 21:

  • New Listings decreased 0.3% to 855
  • Pending Sales increased 4.2% to 823
  • Inventory decreased 16.2% to 14,207

For the month of October:

  • Median Sales Price increased 3.9% to $216,000
  • Days on Market decreased 2.8% to 70
  • Percent of Original List Price Received increased 0.9% to 96.1%
  • Months Supply of Inventory decreased 25.6% to 3.2

All comparisons are to 2014

Click here for the full Weekly Market Activity Report. From The Skinny Blog.

Buyers Active, Sellers Staying Put, Price Gains in Line with Historical Norms

By Erin Milburn on Tuesday, November 17th, 2015

October pending sales rose 3.3 percent to 4,331 contracts. New listings decreased 2.6 percent to 5,798 as fewer sellers listed their properties for sale. It should come as no surprise that inventory levels fell 16.7 percent to 14,911 active units—extending a long-standing supply crunch that is frustrating some buyers but helping sellers yield multiple offers. As one might expect, prices thus continued to rise with the median sales price increasing 4.9 percent compared to last October. That is wholly in line with long-term year-over-year appreciation before factoring for inflation. The median list price rose 4.4 percent to $240,000, while the average price per square foot rose 3.2 percent to $127.

With tight supply and strong demand, sellers accepted a larger share of their original list price as offers were more competitive. The percent of original list price received at sale was up 1.1 percent to 96.2 percent. Homes tended to sell in less time. Days on market declined 2.8 percent to 70 days. Both of these trends are consistent with a sellers market. Further evidence that it’s a good time to sell came by way of months supply of inventory, which fell 25.6 percent to 3.2 months of supply. Generally, five to six months of supply is considered balanced. While the metro as a whole is favoring sellers, not all areas, segments and price points reflect that.

“Sellers are still a bit hesitant,” said Mike Hoffman, Minneapolis Area Association of REALTORS® (MAAR) President. “That said, factors such as low interest rates, rising rents, prices still below their peak and accelerating job and wage growth also paint a compelling picture for buyers.”NL-PS_blog-702x508

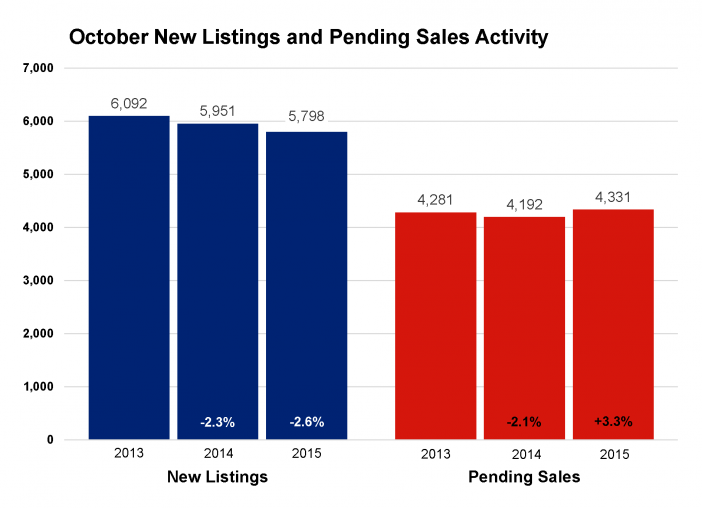
Other market measures show ongoing improvements as well. The percentage of all sales that were foreclosure or short sale has shrunk to less than 10.0 percent. Sales activity in the lower price ranges ($150,000 and below) is declining while activity in all other price ranges is rising. At the high end of the market, year-to-date sales activity in the $1,000,000 and up range has reached all-time record highs. Though it’s not yet the case for the entire region, home prices across several local markets including St. Louis Park, Edina and Southwest Minneapolis have also reached record highs.

The broader economy has been favorable to market recovery. The October jobs report not only beat expectations but it also showed the strongest wage growth in six years—a critical factor that will offset declining affordability and help with down payments. Unemployment has been cut in half from its peak and consumer confidence is rising. October Bureau of Labor Statistics figures show the Minneapolis-St. Paul-Bloomington metropolitan area had the lowest unemployment rate of any major metro at 3.1 percent compared to 5.0 percent nationally. Mortgage rates are still around 4.0 percent compared to a long-term average of over 7.0 percent. A rate hike at the Federal Reserve is expected in December, though changes in mortgage rates will be slow and incremental.

“As we near the end of 2015, it’s clear that home buyers were motivated and eager to make their move,” said Judy Shields, MAAR President-Elect. “Moving forward, we’ll be watching the affordability environment, inventory levels and new construction as we adapt to changing consumer preferences and a changing interest rate climate.”
From The Skinny Blog.

Weekly Market Report

For Week Ending November 14, 2015

For the next several weeks, activity will be lower than it is during the rest of the year but not in complete hibernation. The quietest weeks of the season in residential real estate sales are traditionally from Thanksgiving to New Year’s Day. Generally, we see fewer new listings, less inventory and fewer sales than at any other time during the year. That said, higher year-over-year sales prices are common across the country thanks to things like high demand, low inventory and exceptional interest rates.

In the Twin Cities region, for the week ending November 14:

  • New Listings increased 19.5% to 1,024
  • Pending Sales increased 22.0% to 894
  • Inventory decreased 16.5% to 14,606

For the month of October:

  • Median Sales Price increased 4.2% to $216,500
  • Days on Market decreased 2.8% to 70
  • Percent of Original List Price Received increased 1.1% to 96.2%
  • Months Supply of Inventory decreased 25.6% to 3.2

All comparisons are to 2014

Click here for the full Weekly Market Activity Report. From The Skinny Blog.

Weekly Market Report

For Week Ending November 7, 2015

In a continually improving economy, what we might expect to happen is happening in the housing market. Sales and prices are generally up in year- over-year comparisons, and new listings are replenishing the market at a fairly steady clip. More sellers are still encouraged to enter the fray, as lower inventory continues to remain a point of some concern.

In the Twin Cities region, for the week ending November 7:

  • New Listings increased 7.5% to 1,183
  • Pending Sales increased 10.7% to 907
  • Inventory decreased 16.2% to 14,850

For the month of October:

  • Median Sales Price increased 4.4% to $217,000
  • Days on Market decreased 2.8% to 70
  • Percent of Original List Price Received increased 1.1% to 96.2%
  • Months Supply of Inventory decreased 25.6% to 3.2

All comparisons are to 2014

Click here for the full Weekly Market Activity Report. From The Skinny Blog.

Weekly Market Report

For Week Ending October 31, 2015

Softer September sales continue to be a stout topic for stats analysis. Rental prices are not so soft, however, and across many markets, rising prices are turning heads. More first-time homebuyers may jump at the chance to invest in their own homes. Much of the evidence still points to recovering market health.

In the Twin Cities region, for the week ending October 31:

  • New Listings increased 1.9% to 1,096
  • Pending Sales increased 0.6% to 933
  • Inventory decreased 16.2% to 15,440

For the month of October:

  • Median Sales Price increased 4.9% to $218,000
  • Days on Market decreased 2.8% to 70
  • Percent of Original List Price Received increased 1.1% to 96.2%
  • Months Supply of Inventory decreased 25.6% to 3.2

All comparisons are to 2014

Click here for the full Weekly Market Activity Report. From The Skinny Blog.

Weekly Market Report

For Week Ending October 24, 2015

Data analysis from September national numbers revealed that new home sales underperformed slightly from what was originally expected. Some say this indicates market cooling, but with October giving way to November, it means we will soon have another month of sales to prove or disprove naysayers.

In the Twin Cities region, for the week ending October 24:

  • New Listings decreased 2.5% to 1,233
  • Pending Sales increased 10.7% to 934
  • Inventory decreased 15.7% to 15,650

For the month of September:

  • Median Sales Price increased 8.1% to $221,650
  • Days on Market decreased 8.5% to 65
  • Percent of Original List Price Received increased 1.0% to 96.6%
  • Months Supply of Inventory decreased 23.9% to 3.5

All comparisons are to 2014

Click here for the full Weekly Market Activity Report. From The Skinny Blog.