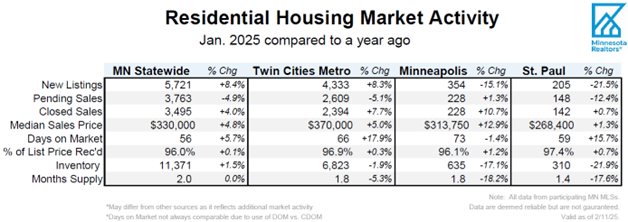
March Housing Market Report

Spring market continues budding; buyers seeing more options

  • Signed purchase agreements rose 7.8%; new listings up 4.0%
  • The median sales price increased 2.8% to $366,000
  • Market times fell 6.9% to 54 days; inventory up 8.4% to 6,879

(Apr. 15, 2024) – According to new data from Minneapolis Area REALTORS® and the Saint Paul Area Association of REALTORS®, both buyer and seller activity rose in March. Inventory levels and prices were also higher.

Sellers, Buyers and Housing Supply
With warmer temperatures comes heightened home buyer and seller activity. Metro-wide, we’ve now seen five consecutive year-over-year increases in new listings and four consecutive increases in pending sales. During the first quarter (YTD), seller activity rose 17.9% while pending sales were up 9.4%. That’s allowed inventory levels to also rise—most recently up 8.4% to 6,879 active listings. While buyers can expect to see more listings in their searches, most areas and sub-markets still favor sellers. There is a good amount of pent-up activity from buyers and sellers that’s been accumulating from when rates jumped. The backlog is starting to be released as more consider making a move. In some ways, residents of the Twin Cities are adjusting to the higher rate environment, but low supply and rising prices combined with higher rates have held back too many from homeownership—particularly first-time buyers without the equity from their first home. Move-up buyers and those looking at pricier segments are less rate-sensitive and so activity is rising more quickly higher up on the price spectrum.

Prices, Market Times and Negotiations
Perhaps surprisingly, REALTORS® still report multiple offer situations in some markets and price points. If rates were to ease further toward 6.0%, that will continue. Listings spent 6.9% fewer days on market compared to last March. And sellers accepted offers at 98.8% of their asking price, up 0.2% from last year. “It’s clear that people are ready and eager to get deals done,” said Jamar Hardy, President of Minneapolis Area REALTORS®. “But even a few months of increases in available listings doesn’t mean the housing shortage is behind us. We’re still having to be persistent, strategic and creative when it comes to getting people into homes.”

Supply levels are too low for prices to fall but rates are too high for prices to rise much. The median home price in March was up 2.8% to $366,000 which amounts to $208 per finished square foot. During the month, sellers accepted offers on their listings after an average of 54 days (median of 24) compared to 58 days last March. Sellers are still in a relatively strong position, but some are having to make concessions by way of a price reduction, seller paid closing costs and other incentives.

“We’re in a unique place. The market remains tight even as we see it loosening a bit with more inventory and more buyers coming out to shop,” said Amy Peterson, President of the Saint Paul Area Association of REALTORS®. “A market like this is never monolithic. Every price point, segment and area are different—sometimes very different. That’s why it’s important to partner with an experienced real estate professional.”

Location & Property Type
Market activity always varies by area, price point and property type. Existing home sales rose faster than new home sales. Single family sales rose while condo and townhome sales declined. Sales over $500,000 rose at over five times the rate of sales under $500,000. Cities such as Robbinsdale, Columbia Heights and Corcoran saw among the largest sales gains while Forest Lake, Victoria and Delano all had notably weaker demand. For cities with at least five sales, the highest priced areas were Medina, Lake Elmo and Orono while the most affordable areas were Red Wing, Mora, Columbia Heights and Faribault.

March 2024 Housing Takeaways (compared to a year ago)

  • Sellers listed 5,261 properties on the market, a 4.0% increase from last March
  • Buyers signed 4,028 purchase agreements, up 7.8% (3,238 closed sales, down 0.9%)
  • Inventory levels rose 8.4% to 6,879 units
  • Month’s Supply of Inventory rose 20.0% to 1.8 months (4-6 months is balanced)
  • The Median Sales Price was up 2.8% to $366,000
  • Days on Market was down 6.9% to 54 days, on average (median of 24 days, down 11.1%)
  • Changes in Pending Sales activity varied by market segment and price point
    • Single family sales rose 12.8%; condo sales were down 15.6%; townhouse sales decreased 1.2%
    • Traditional sales were up 8.0%; foreclosure sales fell 11.9% to 37; short sales rose 11.1% to 10
    • Previously owned sales increased 8.9%; new construction sales were up 2.3%
    • Sales under $500,000 rose 3.9%; sales over $500,000 increased 20.3%


    From The Skinny Blog.

February Housing Market Report

Spring market blossoming early amid signs of turnaround

  • The median sales price increased 4.5% to $357,700
  • Signed purchase agreements rose 13.1%; new listings up 34.5%
  • Market times fell 3.3% to 59 days; inventory up 13.3% to 6,665

(Mar. 18, 2024) – According to new data from Minneapolis Area REALTORS® and the Saint Paul Area Association of REALTORS®, both buyer and seller activity rose in February. Homes also sold in less time and at higher prices.

Sellers, Buyers and Housing Supply
With four consecutive year-over-year increases in new listings and three consecutive year-over-year increases in pending sales, the market turnaround narrative is gaining traction. While inventory levels were up, potential buyers should understand that the market remains significantly undersupplied. In February, sellers listed 34.5% more homes on the market and buyers signed 13.1% more purchase agreements. Sellers unwilling to give up their favorable mortgage rate have withheld listings due to the “rate lock-in effect” but now there is a backlog and we’re seeing some of that activity being released. Buyers had also delayed their purchases until rates came down or until they had some earnings growth, were more able to save for a downpayment and saw more inventory that met their needs. While supply and demand normalize, buyer and seller activity won’t immediately return to previous highs. That will take time—but just how much depends on both market and economic factors. Since these seemingly strong gains are skewed by a low baseline period, it’s not that activity has surged recently as much as activity declined last year at this time due to the Federal Reserve’s inflation fight and rate hikes.

Inventory levels are on the rise in the metro, up 13.3% compared to last February. Those out shopping for homes during this spring market should expect both more listings from pent-up sellers but also more competition from pent-up buyers. In that sense, activity levels will be higher but the balance between supply and demand will remain tight. But if rates do fall further, that could induce even more demand which would cause a resurgence in multiple offer situations and homes selling for over list price. “Perhaps it’s still early to make the call, but it sure feels like we’ve reached a turning point,” said Jamar Hardy, President of Minneapolis Area REALTORS®. “Despite the market ramping up, buyers are still cautious and deliberate but also more optimistic.”

Prices, Market Times and Negotiations
Supply levels are too low for prices to fall but rates are too high for prices to rise much. The median sales price rose 4.5% to $357,700, which amounted to $203 per square foot. During the month, sellers accepted offers at 97.5% of list price after 59 days compared to 97.2% in 61 days last February. Sellers still enjoy pricing power and the upper hand in general but some are having to make concessions by way of price reductions, some seller paid closing costs and other tactics. “There is definitely some momentum heading into spring market,” said Amy Peterson, President of the Saint Paul Area Association of REALTORS®. “But turnarounds rarely happen overnight. Builders play a key role, lenders are being more innovative and consumers are persistent and more realistic.”

Location & Property Type
Market activity always varies by area, price point and property type. New home sales rose at over twice the rate of existing home sales. Single family sales rose at over twice the rate as townhomes. Sales over $500,000 rose at over three times the rate of sales under $500,000. Cities such as Shorewood, Forest Lake, Minnetrista and New Richmond saw among the largest sales gains while Crystal, Andover, Buffalo and Inver Grove Heights all had notably weaker demand. For cities with at least five sales, the highest priced areas were Medina, Orono, North Oaks and Lake Elmo while the most affordable areas were Red Wing, Zumbrota and Vadnais Heights.

February 2024 Housing Takeaways (compared to a year ago)

  • Sellers listed 4,667 properties on the market, a 34.5% increase from last February
  • Buyers signed 3,308 purchase agreements, up 13.1% (2,614 closed sales, up 11.2%)
  • Inventory levels rose 13.3% to 6,665 units
  • Month’s Supply of Inventory rose 28.6% to 1.8 months (4-6 months is balanced)
  • The Median Sales Price was up 4.5% to $357,700
  • Days on Market was down 3.3% to 59 days, on average (median of 38 days, down 13.6%)
  • Changes in Pending Sales activity varied by market segment
    • Single family sales rose 16.8%; condo sales were up 5.4%; townhouse sales increased 7.0%
    • Traditional sales were up 12.8%; foreclosure sales rose 45.5% to 48; short sales were up 37.5% to 11
    • Previously owned sales increased 11.0%; new construction sales rose 26.6%
    • Sales under $500,000 were up 8.9%; sales over $500,000 increased 30.3%

    From The Skinny Blog.

January Housing Market Report

Year off to promising start with gains in listings and sales

  • The median sales price increased 2.3% to $350,000
  • Signed purchase agreements rose 8.0%; new listings up 18.0%
  • Market times fell 8.2% to 56 days; inventory up 1.7% to 6,288

(Feb. 15, 2024) – According to new data from Minneapolis Area REALTORS® and the Saint Paul Area Association of REALTORS®, both buyer and seller activity rose in January. Sales rose from low levels as mortgage rates softened making sellers more confident about listing their homes.

Sellers, Buyers and Housing Supply
Sellers listed 18.0% more homes than last January. That marked a third consecutive month of year-over-year gains in new listings. Sellers are more optimistic about listing their homes and about getting stronger offers. They’re also feeling better about their payments on the next house. On the demand side, pending sales rose 8.0%, suggesting demand could be stabilizing. That second consecutive gain in signed contracts again was helped by lower rates but also reflects a low baseline period. Three consecutive monthly increases in listings and two consecutive monthly sales gains aren’t enough to lift activity levels back to where they were before mortgage rates rose.

The number of active listings statewide stood at 6,288, or 1.7% more than last January. Aspiring buyers planning on shopping during spring market should expect more competition from pent-up demand and will also face stubbornly low inventory levels. Monthly mortgage payments are of top concern when it comes to household budgets. The increase in mortgage rates combined with higher prices has pushed the monthly payment on the typical home up to $2,700 compared to around $1,800 in 2021. Sellers accepted offers at about 96.7% of list price compared to 96.0% flat last January. “While too early to say for sure, we might look back at December and January as a turning point,” said Jamar Hardy, President of Minneapolis Area REALTORS®. “The easing of rates combined with an increase in listings and inventory should mean somewhat smoother sailing for buyers.”

Prices, Market Times and Negotiations
Supply levels are too low for prices to fall but rates are too high for prices to rise much. The median sales price was up 2.3% to $350,000, which amounted to $199 per square foot. Homes lingered on the market for an average of 56 days, which is actually 8.2% faster than last year. In that time, sellers accepted offers at 96.7% of their asking price, which was up from 2023 but down from 2022. “The market activity is rising from the lows of 2023 and the mood is definitely different,” said Amy Peterson, President of the Saint Paul Area Association of REALTORS®. “As we head further into the spring market, the numbers show it’s still a seller’s market in most areas of the Twin Cities and buyers can position themselves for success by being ready to make a strong offer.”

Affordability, Rates and Payments
The Federal Reserve paused the rate hikes, but the impact of higher mortgage rates on monthly payments is hard to ignore. Mortgage rates hit a 23-year high in October 2023 but have retreated since. Recent data suggests the Federal Reserve may not be as willing to start cutting rates in March. The Housing Affordability Index reached its lowest level for January since at least 2004. Affordability is now at roughly 2006 levels. Using some assumptions around taxes and insurance, the monthly payment on the median priced home stood at $2,680 in 2023 compared to $1,760 in 2021. That additional cost can impact savings rates and discretionary spending in the economy.

Location & Property Type
Market activity always varies by area, price point and property type. New home sales rose at ten times the rate of existing home sales. Townhome sales rose at twice the rate as single family homes. Cities such as Medina, Monticello, New Prague and Rogers saw among the largest sales gains while Oak Grove, New Hope, Maplewood and Belle Plaine all had notably weaker demand.

January 2024 Housing Takeaways (compared to a year ago)

  • Sellers listed 3,942 properties on the market, an 18.0% increase from last January
  • Buyers signed 2,780 purchase agreements, up 8.0% (2,186 closed sales, up 3.2%)
  • Inventory levels rose 1.7% to 6,288 units
  • Month’s Supply of Inventory rose 21.4% to 1.7 months (4-6 months is balanced)
  • The Median Sales Price was up 2.3 percent to $350,000
  • Days on Market was down 8.2% to 56 days, on average (median of 39 days, down 9.3%)
  • Changes in Pending Sales activity varied by market segment
    • Single family sales rose 7.5%; condo sales were down 8.9%; townhouse sales were up 14.9%
    • Traditional sales increased 7.6%; foreclosure sales rose 22.6% to 38; short sales were up 250.0% to 14
    • Previously owned sales were up 3.3%; new construction sales increased 33.8%
    • Sales under $500,000 rose 6.3%; sales over $500,000 were up 14.6%


From The Skinny Blog.

2023 Annual Twin Cities Housing Market Report

In 2023, higher interest rates continued to weigh on market activity, yet prices are still up
23-year high mortgage rates and rising prices increased monthly housing costs and slowed buyer activity

Minneapolis–Saint Paul, Minnesota (January 29, 2024) – After sales reached a 20-year high in 2021, sales in 2023 plunged to their lowest level since 2011. The pendulum always overswings. That decline can mostly be tied to higher interest rates along with rising prices and a shortage of housing supply. Mortgage rates rose nearly three-fold between 2021 and 2023—from 2.7% to 8.0%, and yet our region still saw record sales prices, although the pace of those gains has slowed.

2023: A Year in Review
Home sales fell for a second year in a row, according to an annual report issued by Minneapolis Area REALTORS® and the St. Paul Area Association of REALTORS®. Would-be buyers have been discouraged by a triple punch of higher mortgage rates, rising prices and low inventory. Yet, even weaker demand wasn’t enough to pressure prices lower because of the lack of available homes for sale. That meant sellers still saw reasonable offers relatively quickly—but not to the same degree as in 2021 and 2022. Aside from sales volume, in some ways, 2023 represented a return to a more normal, pre-COVID market.

  • New listings were down 12.4% while pending sales were down 15.0%.
  • The median price rose 1.4% while homes spent 29.0% more time on the market.
  • Sales under $500,000 were down 17.0% for the year compared to a 4.0% decline for luxury homes over $1 million.
  • Single family purchase agreements declined 17.2% while townhomes fell 6.2%.
  • Signed contracts on new homes were up 11.3% while they were down 17.7% for existing homes.
  • While newly constructed home inventory rose slightly, builders simply can’t produce enough supply—nor at the right price points—to offset the affordability and supply challenges. Builders do, however, have every incentive to sell their homes and are offering innovative ways to help buyers while existing homeowners are more reluctant to sell and trade up.

While multiple offer situations are still happening but have become less common, waiving inspections and similar tactics have become rarer. Overall, buyers were more cautious and selective throughout the year. Sellers, however, felt the “lock-in” effect where they were reluctant to relinquish their favorable mortgage rates and trade up for a higher rate on a higher priced home. And, as we know, most sellers have to turn right around and be buyers, which partly explains why the largest share of buyers since 2013 chose to leverage their equity from their last home and purchase the next in cash as opposed to contending with higher mortgage rates.

“During the year, we saw many similar trends from the second half of 2022 where higher rates began to weigh heavier on the marketplace,” said Amy Peterson, President of the Saint Paul Area Association of REALTORS®. “We saw fewer listings and fewer sales; and yet higher prices, surprisingly strong offers and relatively quick market times.”

Rate Hikes and Short Supply
The rate hikes meant less activity, but the supply shortage meant decent offers, rising prices and homes selling in a reasonable time frame—albeit longer than the previous two years. Mortgage rates are too high for prices to rise significantly, but supply is too tight for prices to fall. There’s less activity overall but the balance between that buyer and seller activity remains tight. There will always be job, family or health changes that necessitate a home sale or purchase. That’s still happening, but some buyers who wanted to move at a 3.0 or 4.0% rate but don’t have to are choosing to stay put. The Federal Reserve has signaled there’s a good chance rates come down in 2024 in response to inflation cooling, but no guarantees. It would be a welcomed reprieve for frustrated buyers.

“Given the ever-changing nature of real estate, patience, persistence, creativity around financing, and managing expectations are key ingredients to a successful transaction,” said Jamar Hardy, President of Minneapolis Area REALTORS®. “If rates do come down, a lot of pent-up demand that’s been sidelined recently will be unleashed which could lead to another frenzied market with listings selling for over asking price. Whatever happens, it’s critical to work with a qualified market expert to navigate these complexities.”

Impact of Higher Mortgage Rates
Ultimately, residential real estate mostly boils down to monthly payments. That’s where affordability comes in. Relatively few homebuyers pay cash; most take out a mortgage with monthly payments. In that sense, monthly payments matter more than price. In fact, if you downsized to a less costly home last year there’s a chance your payments still rose. Enough well-paying jobs are key to sustaining the monthly payments, upkeep of and demand for homes. That’s why in the short term, rates matter. But in the long run, it’s the economy and labor market that determine the long-term health and sustainability of the housing market.

Since 2020, the typical payment on the median priced home has risen from around $1,600 per month to $2,700 per month. Even as income growth has accelerated over the last few years, that jump is too large a hurdle for too many Minnesotans. Committing a larger share of a household budget to housing also means less discretionary spending elsewhere in the economy, which is a key contributor to economic and job growth. Housing affects the economy, and the economy affects housing.

The impact of higher rates has rippled throughout virtually every corner of the marketplace. Compared to 2022, homes are taking longer to sell (40 vs. 31 days), sellers are accepting less of their asking price (99.3% vs. 100.9%) and absorption rates have risen (1.9 months vs. 1.5). But because the last several years were so unique, it’s worth comparing 2023 to 2019. When compared to 2019, home sales in 2023 were down 26.0% and new listings shrank 21.8%. While market times were up compared to 2022, homes sold more quickly than in 2019 and 2020. Although sellers received on average 99.3% of their list price for the year, they accepted 96.6% in December.

Market Activity by Region
“The [Twin] Cities are wonderful, but we also have an entire state that offers all sorts of different homeownership opportunities,” according to Geri Theis, President of Minnesota Realtors®. “Greater Minnesota offers something for everyone. But too many felt excluded from homeownership due to affordability challenges and we must continue working to change that.” Rural broadband, affordable childcare, education and a labor shortage remain thorny obstacles. “While it was undeniably a challenging year for buyers, over 60,000 Minnesotans were able to close on a home across our great state,” Theis continued.

Market activity always varies by geography, price point and market segment. For example, a large $600,000 single family home in Eden Prairie doesn’t affect a Duluth condo selling for $195,000 or a Brainerd cabin selling for $350,000. And with the rise of remote work, many Minnesotans can telecommute from outside the metro and reside on a lake in a more rural area, for example.

December pending sales—a measure of future demand—rose 8.7% statewide compared to a 3.7% increase in the metro. Home prices rose 3.3% for the month statewide versus 1.1% in just the Twin Cities. Both the metro and the state have below average unemployment rates and above average incomes. Challenges persist, but Minnesota seems well positioned. As inflation continues to cool and the economy remains stable, the rate environment should ease. That could incentivize more demand that would still be faced with a shortage of supply. It should make for an interesting year.

2023 by the Numbers | Compared to 2022

    • Sellers listed 59,581 properties on the market, a 12.4% decrease from 2022
    • Buyers closed on 44,310 properties, down 17.6%
    • The Median Sales Price rose 1.4% to $368,000
    • Inventory levels fell 4.9% to 6,270 units as of year-end
    • Months’ Supply of Inventory was up 26.7% to 1.9 months of supply (5-6 months is balanced)
    • Days on Market increased 29.0% to 40 days, on average (median of 18, up 28.6%)
    • Changes in Sales activity varied by market segment
      • Single family sales were down 20.0%; condos fell 12.8%; townhomes decreased 9.1%
      • Previously owned sales declined 19.2%; new construction sales fell 3.9%
      • $1M+ luxury sales shrank 8.0% but remain near record highs (up 19.3% in December)


From The Skinny Blog.

Sales flatten and prices remain higher, meanwhile new listings rise and rates ease

  • The median sales price increased 2.0% to $362,000
  • Signed purchase agreements fell 1.5%; new listings up 5.3%
  • Market times flat at 40 days; months’ supply up 10.5% to 2.1 months

(Dec. 15, 2023) – According to new data from Minneapolis Area REALTORS® and the Saint Paul Area Association of REALTORS®, metro-wide home prices rose slightly in November. Sales activity was flat as mortgage rates softened slightly and new listings were up 5.3%.

Sellers, Buyers and Housing Supply

Rates have eased from over 8.0% in mid-October to around 7.0% by the end of November. While still elevated relative to the last 20 years, that figure is below its 50-year average. In addition to a low baseline comparison, that decline has helped the number of signed purchase agreements stabilize in November. And because sellers weren’t feeling quite as stuck in their homes, the dip in rates helped boost seller activity as some felt more confident about listing their homes.

Slightly lower rates could mean more buyers will qualify and write offers, and that fewer sellers will feel “locked in” to their mortgage rates. While that could mean more listing activity, it’s likely to be met with demand that’s been pent up for a while in the current affordability environment. Come spring market of 2024, that balance between supply and demand may offer key insights into how the year could play out.

Buyers are still feeling the triple punch of low inventory, rising prices and still relatively high mortgage rates. Comparing pending sales to closed sales can offer unique insights into demand trends. Pending sales were down just 1.5% from last November and are a better leading indicator than closings. Closed sales—reflecting contracts mostly signed in September and October when rates were higher—were down 7.1%. On the supply side, inventory levels across the Twin Cities fell 5.1% compared to last November. While buyers are still finding limited options in their searches, deals are still occurring with some persistence and flexibility. In addition, the lack of existing inventory has benefited the new home market.

More buyers are choosing to deploy cash instead of paying today’s interest rates. Cash sales so far this year are at their highest level since 2014. Overall, since both supply and demand levels are lower, the relative balance hasn’t changed as much as expected. “The recent dip in rates has definitely spurred some buyer interest,” said Jerry Moscowitz, President of Minneapolis Area REALTORS®. “Buyers choosing to wait until spring should expect heightened competition.”

Prices, Market Times and Negotiations

Though seemingly counter-intuitive, home prices continued their ascent, up a modest 2.0% from last November. Prices are rising for several reasons.

  • Supply is short as homeowners with favorable rates remain in their homes.
  • Today’s buyers tend to be better off financially and often use cash for higher-priced homes as higher rates have hindered the mid-end buyer, meaning activity is skewing toward the higher end of the market.
  • Luxury activity continues to outperform along with new construction activity that also skews toward the upper end.

Negotiations held firm but have balanced out recently. Sellers accepted 97.4% of their asking price, which was up from 2022 but down from 2021. Half the homes went under contract in under 23 days compared to 25 days last year. That figure was once again improved from 2022 but softer compared to 2021.

Those two indicators reflect the relatively strong position in which sellers still find themselves, assuming they’re willing to sell. For November, the median home price rose 2.0% to $362,000. The year as a whole will likely show 1.0 to 2.0% price growth. “Buyers seem more sensitive to changes in rates than to the rate itself,” said Brianne Lawrence, President of the Saint Paul Area Association of REALTORS®. “While even a full point decrease in the rate hasn’t magically solved our affordability issues, it does lower monthly payments slightly.”

Affordability, Rates and Payments

Even as the Federal Reserve paused their rate hikes, the impact of mortgage rates on monthly payments is significant. Mortgage rates hit a 23-year high in October but retreated nearly a full point since. The Housing Affordability Index reached its lowest level since at least 2004. Given rates, incomes and prices at the time, affordability was better in 2006 than it is today. Using some assumptions around taxes and insurance, the local monthly payment on the median priced home stands at $2,650 so far this year compared to $1,600 in 2020.

Location & Property Type

Market activity always varies by area, price point and property type. New home sales rose while existing home sales fell. Condo sales rose more than single family and townhome units. Purchase agreements were down 13.0% in St. Paul but up 14.5% in Minneapolis. Cities farther out such as Cologne, Princeton, New Prague and North Oaks saw among the largest sales gains while Monticello, Isanti and Shorewood all had weaker demand.

November 2023 Housing Takeaways (compared to a year ago)

  • Sellers listed 3,657 properties on the market, a 5.3% increase from last November
  • Buyers signed 2,807 purchase agreements, down 1.5% (3,261 closed sales, down 7.1%)
  • Inventory levels shrank 5.1% to 7,819 units
  • Month’s Supply of Inventory rose 10.5% to 2.1 months (4-6 months is balanced)
  • The Median Sales Price was up 2.0 percent to $362,000
  • Days on Market was flat at 40 days, on average (median of 23 days, down 8.0%)
  • Changes in Pending Sales activity varied by market segment
    • Single family sales decreased 1.8%; condo sales were up 12.7%; townhouse sales fell 4.9%
    • Traditional sales declined 2.1%; foreclosure sales rose 71.4% to 36; short sales fell 25.0% to 6
    • Previously owned sales were down 3.7%; new construction sales increased 22.3%
    • Sales under $500,000 decreased 5.3%; sales over $500,000 were up 16.7%

From The Skinny Blog.

Rates briefly break 8.0%, further burdening buyers and stifling sellers

  • The median sales price increased 2.4% to $365,000
  • Signed purchase agreements fell 4.9%; new listings down 1.1%
  • Sellers still getting solid offers at 98.4% of list price in an average of 37 days

(Nov. 15, 2023) – According to new data from Minneapolis Area REALTORS® and the Saint Paul Area Association of REALTORS®, metro-wide home prices rose slightly in October. Sales activity slowed as mortgage rates weighed heavily on the marketplace even as listing activity could be flattening out.

Sellers, Buyers and Housing Supply

At around 8.0%, the fixed 30-year mortgage rate hit its highest level since 2000. Naturally, that weighed on home buyers who are already contending with tight inventory and rising prices. Pending sales were down 4.9% while closings were down 7.9%. It also weighed on would-be sellers and reinforces the “lock-in effect” where existing homeowners are unwilling to let go of their historically low mortgage rates. Sure enough, new listings declined 1.1%, which was the smallest decline since May of last year as the comparisons are more apples-to-apples. Townhomes and condos tend to be more affordable products. Townhome pending sales rose 6.5% while condo closed sales rose 8.4%. With existing homeowners clinging to their interest rate and low monthly payment, new home builders have captured a larger share of the market. New construction pending sales rose 31.6% in October compared to an 8.8% decline for existing homes. New home inventory rose 20.3% over the last 12 months compared to a 4.8% decline for previously owned properties.

Market-wide inventory levels fell 7.7% compared to last October. Millennials and Boomers alike are finding limited options and contending with affordability hurdles. More buyers are choosing to deploy cash instead of paying near 8.0% interest. Cash sales so far this year are at their highest level since 2014. To the surprise of many—and to varying degrees across the region, the market still feels “tight” with rising prices since both buyer and seller activity have declined. When housing supply levels rise but demand falls, that usually results in softening prices. Both supply and demand levels are lower, so the relative balance hasn’t changed as much as many expected. “Inventory is too low for prices to be falling much,” said Jerry Moscowitz, President of Minneapolis Area REALTORS®. “But rates are too high for prices to be rising much.”

Prices, Market Times and Negotiations

This combination of factors has also kept market times relatively brisk and negotiations still favoring sellers, but to a lesser degree than the last few years. Half the homes went under contract in under 20 days compared to 22 days last October, though the average market time rose slightly. Last month sellers accepted 98.4% of their original list price compared to 98.2% last year. Those two indicators reflect the surprisingly strong position in which many sellers still find themselves, assuming they’re willing to sell. This May was the only month of year-over-year price declines since February 2012. The year as a whole will likely show 1.0 to 2.0% price growth. For October, the median home price rose 2.4% to $365,000. “Buyers are feeling the triple punch of low inventory, rising prices and higher rates,” said Brianne Lawrence, President of the Saint Paul Area Association of REALTORS®. “That’s kept a good chunk of buyers sidelined and reflects a real shift from the last few years. That said, there has luckily been some easing in mortgage rates that may continue.”

Affordability, Rates and Payments

Even as the Federal Reserve paused their rate hikes, the impact of mortgage rates on monthly payments is significant. Mortgage rates hit a 23-year high recently. The Housing Affordability Index reached its lowest level since at least 2004. Given rates, incomes and prices at the time, affordability was better in 2006 than it is today. Using some assumptions around taxes and insurance, the monthly payment on the median priced home stands at $2,650 so far this year compared to $1,600 in 2020.

Location & Property Type

Market activity always varies by area, price point and property type. New home sales rose while existing home sales fell. Single family sales were down more than townhome and condo sales. Closings were down 13.9% in St. Paul but up 2.7% in Minneapolis. Cities such as St. Anthony, East Bethel, Somerset and Orono saw among the largest sales gains while New Hope, Robbinsdale and Mounds View all had notably lower demand than last year.

October 2023 Housing Takeaways (compared to a year ago)

  • Sellers listed 5,014 properties on the market, a 1.1% decrease from last October
  • Buyers signed 3,470 purchase agreements, down 4.9% (3,778 closed sales, down 7.9%)
  • Inventory levels shrank 7.7% to 8,630 units
  • Month’s Supply of Inventory rose 15.0% to 2.3 months (4-6 months is balanced)
  • The Median Sales Price was up 2.4 percent to $365,000
  • Days on Market rose 2.8% to 37 days, on average (median of 20 days, down 9.1%)
  • Changes in Pending Sales activity varied by market segment
    • Single family sales decreased 7.8%; condo sales were down 2.3%; townhouse sales rose 6.5%
    • Traditional sales declined 5.1%; foreclosure sales rose 50.0% to 39; short sales fell 33.3% to 4
    • Previously owned sales were down 8.8%; new construction sales increased 31.6%
    • Sales under $500,000 decreased 6.4%; sales over $500,000 were up 2.7%


From The Skinny Blog.

Prices still strong, sales and listings still slow given stubbornly high rates

  • The median sales price increased 2.2% to $370,305
  • Signed purchase agreements fell 7.3%; new listings down 6.4%
  • Sellers still getting strong offers at 99.3% of list price in an average of 34 days

(October 16, 2023) – According to new data from Minneapolis Area REALTORS® and the Saint Paul Area Association of REALTORS®, home prices rose slightly in September. Both buyer and seller activity were lower compared to last year but there were important differences across areas and market segments.

Sellers, Buyers and Housing Supply

Many homeowners are feeling incentivized to stay put—particularly those with sub-4.0% rates who would face much higher payments given the increase in prices and stubbornly high mortgage rates. As a result, new listings were down another 6.4% after a 17.2% decline last September. Buyers face a similar set of considerations, but first-timers don’t have the benefit of equity from previous home ownership, and many struggle to amass a downpayment given the rising cost of living. Closings were down 17.1% but pending sales were down a more modest 7.3%—perhaps offering a glimpse of what’s to come. Millennials now in their prime homeownership years and Boomers looking to downsize are finding limited options. More buyers are choosing to deploy cash instead of paying near 8.0% interest, but that’s difficult for many.

The reason the market still feels so “tight” and why prices continue to rise is because both buyer and seller activity have downshifted in tandem. In the past, we’ve seen housing supply levels rise as demand falls, and that usually results in softening prices. But that’s not the case here. Both supply and demand levels are down, so the relative balance hasn’t changed as much as some anticipated. In addition, sellers don’t appear eager to list their homes any time soon. “Many homeowners not experiencing a major life or job change aren’t quite as motivated to make a move,” said Jerry Moscowitz, President of Minneapolis Area REALTORS®. “Many qualified buyers are finding success purchasing a home now and plan to refinance when the interest rates are lower.”

Prices, Market Times and Negotiations

The downshift on both sides of the closing table has also kept market times relatively brisk and negotiations are still leaning in the seller’s favor. Half the homes went under contract in under 17 days compared to 19 days last September. Last month sellers accepted 99.3% of their original list price compared to 98.9% last year. Those two indicators reflect the surprisingly strong position in which many sellers still find themselves.

Despite softer demand, sluggish seller activity has also kept prices elevated. There has been just one month of year-over-year price declines since February 2012. That was in May of this year. There have been some flat months this year as well as modest gains, but it appears prices could be up slightly for the year. For September, the median home price rose 2.2% to $370,305. “Sellers who locked in low interest rates are reluctant to give them up,” said Brianne Lawrence, President of the Saint Paul Area Association of REALTORS®. “That’s kept inventory low and prices strong, but it still feels quite different from the last few years.” We have 8,700 active listings. That needs to be closer to 20,000 to have a balanced market.

Affordability, Rates and Payments

Even as the Federal Reserve paused and left their target rate unchanged at the September meeting, the 30-year fixed mortgage rate reached its highest level since 2000. The Housing Affordability Index, as expected, hit its lowest level since at least 2004. Given rates, incomes and prices at the time, affordability was better in 2006 than it is today. Using some assumptions around taxes and insurance, the monthly payment on the median priced home stands at $2,650 so far this year compared to $1,600 in 2020.

Location & Property Type

Market activity varies by area, price point and property type. New home sales rose while existing home sales fell. Single family sales were down more than townhome sales. Closings were down around 17.0% in both Minneapolis and St. Paul. Cities such as St. Anthony, Orono, Richfield and Golden Valley saw among the largest sales gains while New Hope, Robbinsdale, Eagan and Andover all had notably lower demand than last year.

September 2023 Housing Takeaways (compared to a year ago)

  • Sellers listed 5,663 properties on the market, a 6.4% decrease from last September
  • Buyers signed 3,686 purchase agreements, down 7.3% (4,126 closed sales, down 17.1%)
  • Inventory levels shrank 9.4% to 8,704 units
  • Month’s Supply of Inventory rose 15.0% to 2.3 months (4-6 months is balanced)
  • The Median Sales Price was up 2.2 percent to $370,305
  • Days on Market rose 6.3% to 34 days, on average (median of 17 days, down 10.5% from last year)
  • Changes in Pending Sales activity varied by market segment
    • Single family sales decreased 8.9%; condo sales were down 6.3%; townhouse sales fell 1.7%
    • Traditional sales declined 7.4%; foreclosure sales rose 11.0% to 40; short sales fell 20.0% to 4
    • Previously owned sales were down 12.0%; new construction sales increased 44.8%
    • Sales under $500,000 fell 10.1%; sales over $500,000 were up 2.8%

From The Skinny Blog.

Prices on the rise again after flattening out; seller activity may be stabilizing

  • The median sales price increased 2.7 percent to $389,900
  • Signed purchase agreements fell 10.5 percent; new listings down 2.8 percent
  • Sellers still getting strong offers at 100.0 percent of their list price

(September 15, 2023) – According to new data from Minneapolis Area REALTORS® and the Saint Paul Area Association of REALTORS®, home prices rose modestly in August. Both buyer and seller activity were lower compared to last year.

Sales & Prices

Pending home sales—or listings with accepted offers—were down 10.5 percent compared to last August. While those declines have moderated, it’s mostly due to comparing to a lower baseline last year as sales were slowing due to rising interest rates causing affordability challenges. Closed sales fell 11.6 percent overall, but townhomes had the smallest decline of any property type while new home sales rose an impressive 33.2 percent. Existing homeowners are choosing to stay put instead of trading up for a substantially higher monthly payment driven by rising prices and mortgage rates. That means builders listing new homes are benefiting from a shift in demand to new construction.

Home prices were down slightly in April and May, up slightly in June, and flat in July. The August median home price was up 2.7 percent from August 2022, up 20.0 percent from August 2021 and up 32.3 percent from August 2020. It’s not clear whether softening prices will continue, that depends on rates and demand. Of the homeowners who did sell their properties, they received an average of 100.0 percent of list price after 32 days on market. Market times were up 18.5 percent from last year, yet homes are still selling faster than in August of 2018 and 2019 and the same pace as 2020. “Not to oversimplify, but prices are rising because we still have a decent number of buyers competing for an insufficient number of homes,“ said Brianne Lawrence, President of the Saint Paul Area Association of REALTORS®. “Sellers of existing homes staying put forces some buyers to look at new homes or consider other more affordable property types such as townhomes, although affordability does vary within that segment.”

Listings and Inventory

In August, sellers listed only 2.8 percent fewer homes than last year, which is the smallest decline since May 2022 and a possible sign some existing supply could start to loosen up. Part of that is also due to a low baseline level. Inventory levels still slid 11.8 percent as of the most recent data. Sellers who locked in low interest rates are reluctant to give them up. “There’s always a certain level of activity in the market because of family changes, economic reasons or relocations to name a few,” said Jerry Moscowitz, President of Minneapolis Area REALTORS®. “But some less motivated buyers without that urgency are looking more cautiously at budgets and monthly payments.”

The balance between buyers and sellers has remained tight because both sales and listings have come down together. There were just over 8,000 active listings at the end of August; that needs to be closer to 20,000 to have a balanced market. At a still-low 2.2 months supply of inventory, buyers don’t have the upper hand some thought they would. Typically 4-6 months of supply are needed to reach a balanced market.

Location & Property Type

Market activity varies by area, price point and property type. New home sales rose 21.1 percent while existing home sales fell 13.9 percent. Single family sales were down 13.5 percent, condo sales decreased 9.0 percent and townhome sales were down just 3.2 percent. Sales in Minneapolis declined 17.0 percent while Saint Paul sales fell 11.5 percent. Cities such as Rogers, Otsego, Medina and Victoria saw the largest sales gains while Red Wing, East Bethel and Columbia Heights all had notably lower demand than last year.

For more information on weekly and monthly housing numbers visit www.mplsrealtor.com or www.spaar.com

August 2023 Housing Takeaways (compared to a year ago)

  • Sellers listed 6,077 properties on the market, a 2.8 percent decrease from last August
  • Buyers signed 4,468 purchase agreements, down 10.5 percent (4,983 closed sales, down 11.6 percent)
  • Inventory levels shrank 11.8 percent to 8,111 units
  • Month’s Supply of Inventory rose 15.8 percent to 2.2 months (4-6 months is balanced)
  • The Median Sales Price was up 2.7 percent to $389,900
  • Days on Market rose 18.5 percent to 32 days, on average (median of 15 days, unchanged from last year)
  • Changes in Sales activity varied by market segment
    • Single family sales decreased 13.5 percent; condo sales were down 9.0 percent; townhouse sales fell 3.2 percent
    • Traditional sales declined 11.9 percent; foreclosure sales rose 178.9 percent to 53; short sales were flat at 7
    • Previously owned sales were down 13.9 percent; new construction sales increased 21.1 percent
    • Sales under $500,000 fell 13.6 percent; sales over $500,000 were down 4.3 percent


From The Skinny Blog.

Prices still flat while sales declines continue with rates sticky around 7%

  • The median sales price remained flat at $375,000
  • Signed purchase agreements fell 9.5 percent; new listings down 16.0 percent
  • Sellers accepted offers for an average of 100.8 percent of their list price

(August 15, 2023) – According to new data from Minneapolis Area Realtors® and the Saint Paul Area Association of REALTORS®, home prices were flat in July. Both buyer and seller activity were lower compared to July 2022.

Sales & Prices

Home prices were down slightly in April and May, up slightly in June, and flat in July. April marked the first year-over-year price decline since February 2012. The typical home price is now up 7.1 percent from 2021, up 20.0 percent from 2020 and up 32.3 percent from 2019. But market dynamics always vary by price point, property type and location. Signed purchase agreements fell 9.5 percent from last July when buyer activity had already declined in the face of higher rates. Closings were down 21.4 percent but are a lagging indicator. As a more forward-looking indicator, pending sales are a more timely measure.

Of the sellers that did list and sell their properties, they received an average of 100.8 percent of list price after 29 days on market. This reflects a persistently tight supply picture. Homes are still selling faster than in July of 2018, 2019 and 2020. “It still surprises me how often I hear and read about a crash,” said Brianne Lawrence, President of the Saint Paul Area Association of REALTORS®. “Prices flattening out and homes spending longer on market combined with a possible downtick in rates could be just the medicine the doctor ordered for frustrated buyers.”

Listings and Inventory

July sellers listed 16.0 percent fewer homes on the MLS than last year. Inventory levels slid a similar 16.1 percent. Would-be sellers are faced with a unique decision: stay put in a home that no longer meets their needs or take their equity and embrace higher prices and rates until refinancing. Sellers are feeling the “golden handcuffs” and are reluctant to swap a 3.0 percent rate for 7.0 percent. “When is the best time to buy a home? When you’re ready,” said Jerry Moscowitz, President of Minneapolis Area Realtors®. “Focus on what you can’t change such as layout and location. Rooms can be repainted. Counters and appliances can be updated. Loans can be refinanced.”

Both supply and demand have come down in unison, meaning the balance between buyers and sellers remains tight. Inventory levels fell 16.1 percent in July to 7,842 active listings. The market still favors sellers, but not to the same degree as the last few years. The market has 2.1 months supply of inventory but typically 4-6 months of supply are needed to achieve a balanced market.

Location & Property Type

Market activity varies by area, price point and property type. New home sales rose 61.8 percent while existing home sales were down 13.5 percent. Single family sales fell 11.6 percent, condo sales were flat and townhome sales were down 4.5 percent. Sales in Minneapolis decreased 12.7 percent while Saint Paul sales fell 13.8 percent. Cities such as Mounds View, St. Anthony, Zumbrota and Vadnais Heights saw the largest sales gains while Hudson, Cambridge, New Richmond and Monticello all had notably lower demand than last year.

July 2023 Housing Takeaways (compared to a year ago)

  • Sellers listed 5,823 properties on the market, a 16.0 percent decrease from last July
  • Buyers signed 4,408 purchase agreements, down 9.5 percent (4,387 closed sales, down 21.4 percent)
  • Inventory levels shrank 16.1 percent to 7,842 units
  • Month’s Supply of Inventory rose 10.5 percent to 2.1 months (4-6 months is balanced)
  • The Median Sales Price was flat at $375,000
  • Days on Market rose 31.8 percent to 29 days, on average (median of 12 days, up 9.1 percent)
  • Changes in Sales activity varied by market segment
    • Single family sales decreased 11.6 percent; condo sales were flat & townhouse sales fell 4.5 percent
    • Traditional sales declined 9.9 percent; foreclosure sales rose 95.0 percent to 39; short sales rose 233.3 percent to 10
    • Previously owned sales were down 13.5 percent; new construction sales increased 61.8 percent
    • Sales under $500,000 fell 11.7 percent; sales over $500,000 gained 1.3 percent


From The Skinny Blog.

Prices resume their ascent; sales declines moderating; sellers still sluggish

  • The median sales price was up 0.5 percent from last June to $382,000
  • Signed purchase agreements fell 10.8 percent; new listings down 16.5 percent
  • Sellers accepted offers for an average of 101.3 percent of their list price

(July 16, 2023) – According to new data from Minneapolis Area REALTORS® and the Saint Paul Area Association of REALTORS®, home prices rose slightly in June. Both buyer and seller activity were also lower compared to last June.

Sales & Prices

Prices were down slightly in April and May but up 0.5 percent in June. April marked the first year-over-year price decline since February 2012. Half of all homes sold for over $382,000. But as in April and May, sellers in June still accepted offers above list price despite a decline in sales—a dynamic that reflects the lack of supply despite rising mortgage rates. Sellers received offers at 101.3 percent of their asking price. Market times—while up—still reflect a relatively fast-paced market. Half the sales went under contract in under 12 days. And homes are still selling faster than in June 2018, 2019 and 2020.

“Some remain convinced of an impending crash, but we’re still not seeing it,” said Brianne Lawrence, President of the Saint Paul Area Association of REALTORS®. “Two months of prices softening around 1.0 percent before climbing again is more like a blip or pause than a downturn.” But the Fed-driven decline in demand persists. As we compare to slower months of 2022, the sales declines have moderated. Pending sales dipped 10.8 percent; closed sales fell 18.0 percent.

Listings and Inventory

June sellers brought 16.5 percent fewer new listings to market than last year. Inventory levels slid 9.0 percent lower. Some sellers are choosing to stay put and wait instead of selling for a lower price. Most sellers are also buyers and are reluctant to trade away their 3.0 percent interest rate for 6.8 percent. “Even with fewer sales in light of higher rates, homes are still selling relatively quickly while sellers get relatively strong offers,” said Jerry Moscowitz, President of Minneapolis Area REALTORS®. “That’s partly driven by homeowners with rates under 4.0 percent staying put.”

Both supply and demand have come down in tandem, meaning the balance between buyer and seller activity has remained tight. Inventory levels fell 13.4 percent in June to 7,492 active listings. The market still favors sellers, but not to the same degree as the last few years. Our 2.0 months supply of inventory was up 17.6 percent. Typically 4-6 months of supply are needed to achieve a balanced market.

Location & Property Type

Market activity varies by area, price point and property type. New home sales rose 24.3 percent while existing home sales were down 12.8 percent. Single family sales fell 13.7 percent, condo sales declined 3.2 percent and townhome sales were up 0.8 percent. Sales in Minneapolis decreased 12.1 percent while Saint Paul sales fell 12.9 percent. Cities such as Annandale, Shorewood, White Bear Township and Delano saw the largest sales gains while White Bear Lake, New Hope, New Prague, Zimmerman and Hudson all had notably lower demand than last year.

June 2023 Housing Takeaways (compared to a year ago)

  • Sellers listed 6,664 properties on the market, a 16.5 percent decrease from last June
  • Buyers signed 4,997 purchase agreements, down 10.8 percent (5,343 closed sales, down 18.0 percent)
  • Inventory levels shrank 13.4 percent to 7,492 units
  • Month’s Supply of Inventory rose 17.6 percent to 2.0 months (4-6 months is balanced)
  • The Median Sales Price rose 0.5 percent to $382,000
  • Days on Market rose 47.6 percent to 31 days, on average (median of 12 days, up 50.0 percent)
  • Changes in Sales activity varied by market segment
    • Single family sales decreased 13.7 percent; Condo sales were down 3.2 percent & townhouse sales rose 0.8 percent
    • Traditional sales declined 11.0 percent; foreclosure sales rose 76.0 percent (44); short sales decreased 33.3 percent (4)
    • Previously owned sales were down 12.8 percent; new construction sales rose 24.3 percent
    • Sales under $500,000 fell 12.9 percent; sales over $500,000 declined 0.4 percent


From The Skinny Blog.