By Aubray Erhardt on Wednesday, September 14th, 2016
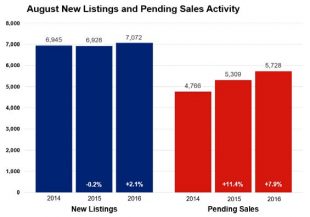
Seller activity increased 2.1 percent since last August, as sellers introduced 7,072 new listings to the marketplace. Buyer activity also rallied. Pending sales rose 7.9 percent while closed sales gained 7.4 percent. To fuel those gains, buyers signed 5,728 new contracts and closed on 6,382 homes. That closed sales figure is on par with 2004 levels. Although the median sales price has reached its seasonal peak for 2016, it increased 5.7 percent since August 2015 to $237,750. Adding to the pressure facing buyers, inventory levels fell 18.8 percent to 13,933 active properties. Inventory constraints haven’t slowed down buyers yet, but additional listings are needed to ease the contentious landscape.
 Low inventory has enabled homes to sell in near record time. Average days on market until sale fell 14.1 percent to 55 days. That’s the second fastest market time for any month since the beginning of 2007. The average percent of original list price received at sale was 97.9 percent, the highest figure for any August since 2005. Months supply of inventory fell 24.3 percent to 2.8 months—the lowest August figure on record since the beginning of 2003. Generally, five to six months of supply is considered a balanced market. This indicator measures the balance between supply and demand in the marketplace.
“Absorption rates under 3.0 months suggests things are still pretty tight out there as we transition to autumn,” said Judy Shields, Minneapolis Area Association of REALTORS® (MAAR) President. “But there are still peculiarities across locations and segments. Blaine is not Linden Hills and downtown condos are not suburban single family new construction. It’s important to have all the facts before making a move.”
Despite the fact that both seller and buyer activity increased in August, important asymmetries persist. Over the last three years, buyer activity has steadily marched higher while seller activity has essentially bounced around the 7,000 unit marker, thus straining supply levels.
A strong Twin Cities labor market has also helped promote housing recovery. The most recent national unemployment rate is 4.9 percent, though it’s a healthier 3.5 percent locally. The Minneapolis-St. Paul-Bloomington metropolitan area has the second lowest unemployment rate of any major metro area, trailing only Denver by 0.1 percent.
Locally, the 30-year fixed mortgage rate stands at 3.47 percent compared to a long-term average of about 8.0 percent. Rates are now at their lowest level in three years. Marginally higher rates were widely expected in 2016, but the Federal Reserve hasn’t made a move since last December. Markets currently peg the odds of a September rate hike at around 20.0 percent. Barring any surprising economic data, the Fed will likely raise rates this December.
“In the near term, buyer and seller activity always quiets down around this time of year and that shouldn’t cause concern,” said Cotty Lowry, MAAR President-Elect. “Over the long term, favorable interest rates, rising rents and a strong labor market should be conducive to housing. But we’ll need some additional inventory—particularly in the affordable brackets—in order to keep up with consumer demand.”
From The Skinny Blog.