Twin Cities Home Price Analysis

By David Arbit on Thursday, June 18th, 2015

Assuming-5-pct-appreciation-310x225
After nearly 10 years, home prices are within 6.3 percent of their record high seen in June 2006. We have been here before, but we are in a different environment these days. The labor market has benefited from the longest stretch of private job growth on record, the stock market is at all-time highs, corporate balance sheets have seldom looked this good, we have a more regulated lending environment, consumers are deleveraged, our population has grown and consumers are more cautious this time around.

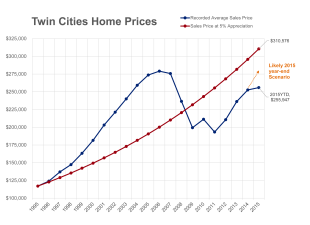
As we near (errr return to) “peak” pricing, there are several important items to bear in mind. First, this is not a brand new high in some foreign land, it is a return to where the market was 10 years ago but with better fundamentals (see above). Second—and as the chart suggests—if you assume that prices had followed their long term trend of increasing at 5.0 percent per year (nominal, not adjusted for inflation) as they have, we are still not back to where we would be assuming that rate of increase over the last 20 years. Third, this market is not fueled by irrational, unjustified speculation and exuberance—a leading cause of bubble-itus. Rather, it is fueled by low interest rates, rising rents, job growth, a diverse and robust local economy and slowly rising incomes.

Those who remember paying $0.05 for a cup of coffee or a candy bar like to remind us: prices will rise. It is inevitable. To expect home prices not to follow that trend is unrealistic. Once home prices began recovering, it was only a matter of time before they surpass their previous peak. Given all the improvements we have seen in the market and economy, it is no surprise we are back to where we were. But this time, under much better circumstances.
From The Skinny Blog.

Weekly Market Report

For Week Ending June 13, 2015

When Lewis and Clark looked over the horizon and saw the Pacific Ocean, they were charting the future while applying lessons learned on a long, historic journey. In the housing market, it is also important to look to the future with a nod to the past. The market has come a long way since the burst of 2008. May we always thank the past for teaching us how to pursue our futures. And may we always have a market interpreter as able and wise as Sacagawea.

In the Twin Cities region, for the week ending June 13:

  • New Listings decreased 0.8% to 2,058
  • Pending Sales increased 21.1% to 1,523
  • Inventory decreased 6.0% to 16,512

For the month of May:

  • Median Sales Price increased 6.7% to $224,000
  • Days on Market decreased 5.0% to 76
  • Percent of Original List Price Received increased 0.7% to 97.5%
  • Months Supply of Inventory decreased 9.8% to 3.7

All comparisons are to 2014

Click here for the full Weekly Market Activity Report. From The Skinny Blog.

Weekly Market Report

For Week Ending June 6, 2015

As we approach the halfway point of the year, we’ll begin to see some midterm report cards from anyone who wants to share an opinion or write a headline. If you have been reading these weekly excerpts, you already know that we are tracking along a predicted path. The residential real estate market was expected to be good at this point. Hiring is up, unemployment is low, sales are up, rates are low, prices are up and inventory is low. The gentle sway of up and low is making for an enjoyable ride, with no bubbles in sight.

In the Twin Cities region, for the week ending June 6:

  • New Listings increased 1.4% to 2,183
  • Pending Sales increased 10.9% to 1,413
  • Inventory decreased 5.2% to 16,253

For the month of May:

  • Median Sales Price increased 6.7% to $224,000
  • Days on Market decreased 5.0% to 76
  • Percent of Original List Price Received increased 0.7% to 97.5%
  • Months Supply of Inventory decreased 12.2% to 3.6

All comparisons are to 2014

Click here for the full Weekly Market Activity Report. From The Skinny Blog.

May 2015 Real Estate Stats for the Twin Cities

By Aubray Erhardt on Thursday, June 11th, 2015

MEDIAN HOME PRICE JUST SHY OF RECORD HIGH AMIDST STRONGEST DEMAND IN A DECADE

With the sole exception of inventory, every market metric showed continued improvement during May. The number of signed purchase agreements in the 13-county Twin Cities increased 19.5 percent to 6,228. That marks the highest May pending sales count since 2005. Sellers, however, were only slightly more active than last year. New listings rose 0.3 percent to 8,590 for the month. Excluding April 2015, that’s the highest number of new listings for any month since the home buyer tax credit period of April 2010. Homes also sold in less time and sellers yielded a higher share of their list price.

The May 2015 median sales price of all MLS home sales increased 6.7 percent to $224,000. That’s within 3.6 percent of the May 2006 level and 6.3 percent of the record high seen in June 2006. Price per square foot offers a different perspective, as it accounts for the increasing square footage of homes selling. The average price buyers paid per square foot rose 3.5 percent to $128.

“Though it’s not the only important measure by a long shot, many factors have enabled prices to once again approach these levels,” said Mike Hoffman, Minneapolis Area Association of REALTORS® (MAAR) President. “It’s taken nearly 10 years just to get this close to break-even and this time the fundamentals are better, our population has grown and industry professionals and consumers are more cautious.”

Monthly-MSP

Persistent rent hikes, low mortgage rates, solid job growth and some noticeable wage growth are all encouraging consumers to seriously consider homeownership. But sellers and builders have been reluctant to list and build at the same levels they did when demand was this high 10 years ago. That has kept us in a seller’s market for some time. The number of days a listing spends on the market also reflects this. Those selling their homes are waiting a median of 35 days before accepting an offer at a median of 99.5 percent of their current list price. May months supply of inventory fell 12.2 percent to 3.6 months. Markets with between five and six months of supply are considered balanced.

Over the last 12 months, buyer activity increased the most in the townhome segment, where properties are also selling the fastest. Condominium prices increased the most of any property type over the same period. New construction pending sales for May increased at about half the rate of previously-owned properties. The number of homes on the market in May fell for all property and construction types.

The finance environment remains attractive. Mortgage rates are hovering around 4.0 percent, compared with a long-term average of 7.0 percent. The Twin Cities housing affordability index increased 2.7 percent since May 2014. An educated and literate workforce combined with a healthy and diverse economy helps Minnesota compete for top talent and businesses on an international scale.

“Many brokerages are seeing record volume even as prices move toward 2006 levels,” said Judy Shields, MAAR President-Elect. “Buyers in a variety of segments in our wonderful region are eager to make homeownership a reality. Prospective sellers should take note—they’re likely to receive top dollar for their property.”
From The Skinny Blog.

Weekly Market Report

For Week Ending May 30, 2015

As we get closer to the official calendar launch of summer, residential real estate is taking off. The market may seem slower than in past spring/summer sprints, but numbers are by no means dismal. Whether the buyer category is dominated by Millennial, Generation X or move-up buyers from previous generations is no matter; activity is happening.

In the Twin Cities region, for the week ending May 30:

  • New Listings decreased 2.9% to 1,696
  • Pending Sales increased 23.5% to 1,357
  • Inventory decreased 4.6% to 16,202

For the month of May:

  • Median Sales Price increased 6.7% to $224,000
  • Days on Market decreased 5.0% to 76
  • Percent of Original List Price Received increased 0.7% to 97.5%
  • Months Supply of Inventory decreased 12.2% to 3.6

All comparisons are to 2014

Click here for the full Weekly Market Activity Report. From The Skinny Blog.

Exactly What is the Trend?

By David Arbit on Tuesday, June 2nd, 2015

“The trend is your friend.”

We don’t know who said it, or when. But we believe the spirit of that statement is to ignore the micro fluctuations in the data and focus on the overall, macro-level pattern. Let the trend speak to you. Ignore the noise in between. The noise is only there to confuse you. Actually, the noise is really there because buyer activity ebbs and flows with the freeze and thaw cycle as well as with the school year. Though it’s tempting to follow the seasonal peaks and valleys, it’s plain to see that prices and sales always decline between summer and fall, and then subside again between fall and winter. It’s as predictable as potholes in the Minnesota spring. As such, it’s less meaningful to compare June to October and far more meaningful to compare October of this year to October of last year. Because of this high degree of seasonality in our market, comparisons across all of our reporting environments utilize a year-over-year benchmark.

What-is-the-Trend
From The Skinny Blog.

Weekly Market Report

For Week Ending May 23, 2015

The pattern has continued mostly unabated for the first part of the year thus far. In year-over-year comparisons, new listings have been up, sales have been up and inventory has been down. This was expected when the year began, and it has been a comfort to see this level of predictability. When something as important as a home purchase feels like a safe bet, the economy can continue to improve and prosperity is palpable.

In the Twin Cities region, for the week ending May 23:

  • New Listings increased 0.7% to 1,881
  • Pending Sales increased 18.6% to 1,500
  • Inventory decreased 4.0% to 16,078

For the month of April:

  • Median Sales Price increased 9.7% to $215,000
  • Days on Market decreased 4.5% to 85
  • Percent of Original List Price Received increased 1.1% to 97.0%
  • Months Supply of Inventory decreased 2.8% to 3.5

All comparisons are to 2014

Click here for the full Weekly Market Activity Report. From The Skinny Blog.