Weekly Market Report

For Week Ending February 13, 2021

The Mortgage Bankers Association’s most recent National Delinquency Survey reported that the delinquency rate for mortgage loans on one-to-four unit residential properties declined to a seasonally adjusted rate of 6.73 percent of all loans outstanding in Q4 2020. The percent of loans delinquent was down nearly one percent from Q3 2020, but still up nearly three percent from one year ago.

In the Twin Cities region, for the week ending February 13:

  • New Listings decreased 6.6% to 1,120
  • Pending Sales decreased 3.6% to 981
  • Inventory decreased 42.3% to 4,833

For the month of December:

  • Median Sales Price increased 11.5% to $301,000
  • Days on Market decreased 37.3% to 42
  • Percent of Original List Price Received increased 2.6% to 99.5%
  • Months Supply of Homes For Sale decreased 47.1% to 0.9

All comparisons are to 2020

Click here for the full Weekly Market Activity Report. From MAAR Market Data News.

Twin Cities housing market off to strong start for the year

Sales up, price growth strong, market times fast, but new listings down and supply levels very low

(February 17, 2021) – According to new data from the Minneapolis Area REALTORS® and the Saint Paul Area Association of REALTORS®, buyer activity in the 16-county Twin Cities metro continues to climb above 2020 levels. Closed sales rose 14.6 percent from last January and new signed purchase agreements were up 5.6 percent over last year. That marks the strongest January pending sales since 2005 and the highest closed sales figure since at least 2003.

Despite the unyielding commitment from buyers in 2020, there are not enough homes on the market—particularly in the affordable ranges—to satisfy the historic demand. Sellers listed 8.8 percent fewer homes than January 2020, further shrinking an already historically low inventory of available homes.

“Last year was incredibly strong and so far 2021 is keeping up the pace,” according to Todd Walker, President of Minneapolis Area REALTORS®. “Rates are as attractive as they’ve ever been and the demand is persistent, but the challenge is still the lack of supply.”

The number of homes for sale in January was down 42.6 percent compared to a year ago. That amounts to 0.9 months of supply, while a balanced market has 4-6 months of supply. This dynamic has given rise to four other trends: sellers are getting historically strong offers, homes are selling in record time, multiple offers and competitive bidding have become commonplace and home prices are rising quickly relative to incomes.

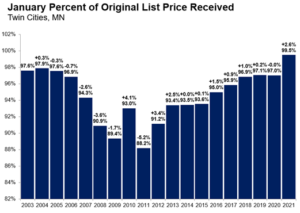
“There are many motivated buyers out there but not nearly enough homes for them on the market,” said Tracy Baglio, President of the Saint Paul Area Association of REALTORS®. “Proper pricing is still critical, but sellers are accepting offers that are at or very close to list price, occasionally above it in the first-time buyer segments.”

Pending sales were up 39.4 percent in Minneapolis and 14.0 percent in St. Paul, indicating buyer interest remains quite strong in the core cities. Perhaps surprisingly, condos saw the strongest sales growth followed by single family and then townhomes. New construction sales rose 12.2 percent compared to a 16.0 percent increase for previously owned homes. Sales of luxury properties ($1M+) have been rallying—up 75.0 percent from last January.

For more information on weekly and monthly housing numbers visit www.mplsrealtor.com or www.spaar.com

January 2021 by the numbers compared to a year ago

  • Sellers listed 3,989 properties on the market, an 8.8 percent increase from last January
  • Buyers signed 3,519 purchase agreements, up 5.6 percent (3,335 closed sales, up 14.6 percent)
  • Inventory levels fell 42.6 percent to 4,823 units
  • Months Supply of Inventory was down 47.1 percent to9 months (5-6 months is balanced)
  • The Median Sales Price rose 11.5 percent to $301,000
  • Days on Market decreased 37.3 percent to 42 days, on average (median of 22, down 50.0 percent)
  • Changes in Sales activity varied by market segment
    • Single family sales were up 16.3 percent; condo sales rose 18.3 percent; townhome sales increased 7.8 percent
    • Traditional sales rose 16.2 percent; foreclosure sales were down 35.1 percent; short sales fell 44.4 percent
    • Previously owned sales were up 16.0 percent; new construction sales climbed 12.2 percent

From The Skinny Blog.

Weekly Market Report

For Week Ending February 6, 2021

Popular home services marketplace HomeAdvisor released their State of Home Spending Report, which details trends in homeowner improvement projects. Among survey participants, the total spending on home projects rose from an average of $9,078 in 2019, to an average of $13,138 in 2020. The more than $4,000 increase in average expenditure was likely due to an increase in the amount of work completed as well as the increased supply and labor costs due to COVID-19.

In the Twin Cities region, for the week ending February 6:

  • New Listings decreased 16.6% to 1,117
  • Pending Sales increased 9.9% to 1,068
  • Inventory decreased 41.0% to 4,873

For the month of December:

  • Median Sales Price increased 11.5% to $301,000
  • Days on Market decreased 37.3% to 42
  • Percent of Original List Price Received increased 2.6% to 99.5%
  • Months Supply of Homes For Sale decreased 47.1% to 0.9

All comparisons are to 2020

Click here for the full Weekly Market Activity Report. From MAAR Market Data News.

Weekly Market Report

For Week Ending January 30, 2021

A strong housing market isn’t just a local activity, and two recently released reports provide us with insights to the strength of residential real estate nationally. The S&P CoreLogic Case-Shiller National Home Price NSA Index rose 9.49% in December 2020 from its December 2019 level. Meanwhile, the National Association of REALTORS® existing home sales report found the median price of existing home sales nationwide rose to $309,800 in December 2020, up 12.9% from the year before.

In the Twin Cities region, for the week ending January 30:

  • New Listings decreased 2.8% to 976
  • Pending Sales decreased 1.8% to 923
  • Inventory decreased 40.3% to 4,992

For the month of December:

  • Median Sales Price increased 10.0% to $307,000
  • Days on Market decreased 30.4% to 39
  • Percent of Original List Price Received increased 2.5% to 99.7%
  • Months Supply of Homes For Sale decreased 41.2% to 1.0

All comparisons are to 2020

Click here for the full Weekly Market Activity Report. From MAAR Market Data News.

Weekly Market Report

For Week Ending January 23, 2021

The U.S. Department of Housing and Urban Development released their December housing report this week showing overall housing starts increased by a seasonally adjusted annual rate of 1.67 million units. Single-family housing starts increased 12 percent to a 1.34 million unit seasonally adjusted annual rate, the highest level since September 2006. Expectations are for further increases in building activity in 2021, though rising material costs and a lack of buildable lots and labor will temper activity and affect affordability.

In the Twin Cities region, for the week ending January 23:

  • New Listings decreased 4.6% to 899
  • Pending Sales increased 9.1% to 879
  • Inventory decreased 40.6% to 5,056

For the month of December:

  • Median Sales Price increased 10.0% to $307,000
  • Days on Market decreased 30.4% to 39
  • Percent of Original List Price Received increased 2.5% to 99.7%
  • Months Supply of Homes For Sale decreased 41.2% to 1.0

All comparisons are to 2020

Click here for the full Weekly Market Activity Report. From MAAR Market Data News.

December Monthly Skinny Video

December is normally one of the slowest months of the year, but strong buyer demand across most segments of the market, buoyed by near record-low interest rates, continues to drive a healthy sales pace in the face of a new wave of COVID-19 infections and a softening job market.