Weekly Market Report

For Week Ending November 18, 2017

Home price appreciation is on the rise in most of the country, which is welcome news for any homeowner that experienced a time when it was not. Although trends vary by region and state, the overarching trend is increased prices, according to research performed by the National Association of REALTORS® on American Community Survey data from 2005 through 2016. Price growth is strongest in the South and less so in the Northeast, and only a few states show no growth or losses. Affordability is most favorable in the Midwest, and the West is least affordable, on average.

In the Twin Cities region, for the week ending November 18:

  • New Listings decreased 6.6% to 896
  • Pending Sales decreased 5.1% to 912
  • Inventory decreased 20.1% to 10,407

For the month of October:

  • Median Sales Price increased 6.1% to $244,000
  • Days on Market decreased 14.8% to 52
  • Percent of Original List Price Received increased 0.8% to 97.7%
  • Months Supply of Inventory decreased 18.5% to 2.2

All comparisons are to 2016

Click here for the full Weekly Market Activity Report. From The Skinny Blog.

Weekly Market Report

For Week Ending November 11, 2017

During the final two months of the year, residential real estate traditionally slows down to make way for more holiday, travel and retail spending. Assessing the dominant trend of 2017, most housing markets have seen the number of homes for sale decrease in year-over-year comparisons. So much so, that further decreases in 2018 will be newsworthy, as prices would likely keep rising in a seller’s market. Presently, in a thriving economy with low unemployment, agents and consumers alike still have reason for optimism.

In the Twin Cities region, for the week ending November 11:

  • New Listings decreased 7.6% to 924
  • Pending Sales increased 7.1% to 976
  • Inventory decreased 18.5% to 10,871

For the month of October:

  • Median Sales Price increased 6.1% to $244,000
  • Days on Market decreased 14.8% to 52
  • Percent of Original List Price Received increased 0.8% to 97.7%
  • Months Supply of Inventory decreased 18.5% to 2.2

All comparisons are to 2016

Click here for the full Weekly Market Activity Report. From The Skinny Blog.

Market flat in preparation for winter

By Erin Milburn on Wednesday, November 15th, 2017

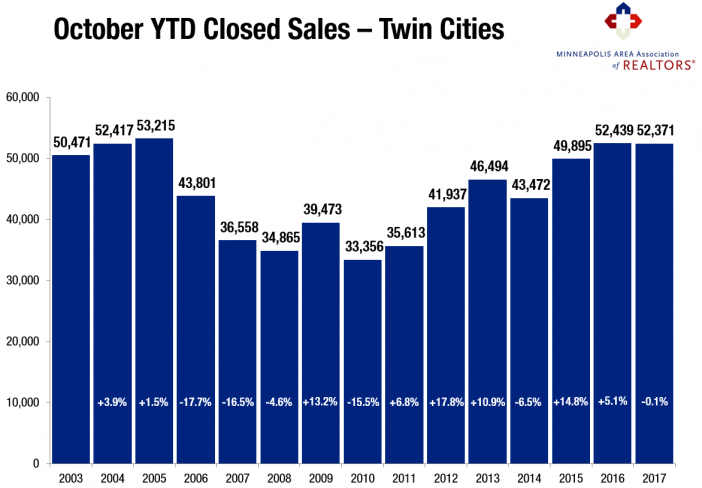
Minneapolis, Minnesota (November 15, 2017) – The Twin Cities housing market is holding steady after both sales and prices reached record highs this year. In October, new listings were up 3.1 percent compared to last October but are on-track for a 2.0 percent decline for the year. Pending sales rose 3.9 percent for the month but will likely be flat compared to all of 2016. Closed sales eked out a 0.3 percent October gain but are also likely to be flat for the year. The number of homes for sale decreased 18.0 percent to 11,221. Absorption rates contracted as well.

Given strong demand and low supply, prices held their ground and marched higher. The median sales price rose 6.1 percent from last October to $244,000. This price metric will likely show a 6.5 percent annual increase. Home prices have now risen for the last 68 consecutive months or over 5.5 years. At 52 days on average compared to 61 last October, homes went under contract 14.8 percent faster. Sellers who list their properties are averaging 97.7 percent of their original list price, 0.8 percent higher than October 2016. The metro area has just 2.2 months of housing supply. Generally, five to six months of supply is considered a balanced market where neither buyers nor sellers have a clear advantage.

“We’re still very much on-track with last year’s sales levels,” said Cotty Lowry, Minneapolis Area Association of REALTORS® (MAAR) President. “At this point in the year, we begin to look toward annual numbers that are less susceptible to weather and other variables. With only two months to go, we are running just about 70 sales shy of last year’s levels. That’s quite impressive given our dramatic supply shortage.”
Oct2017YTD_ClosedSales_PR-702x488
Headline figures can often mask important details and specifics of which buyers and seller should be aware. For example, year-to-date, closed sales only fell for homes under $250,000. Sales activity increased for homes priced between $250,000 and $500,000, $500,000 and $1,000,000 and for properties over $1,000,000. Market times and the ratio of sales price to list price both improved for each of the above four price ranges. Traditional market activity continues to eclipse distressed activity.

The economy and political climate affect housing. The national unemployment rate is 4.1 percent, though it’s 2.9 percent locally—the third lowest unemployment rate of any major metro area. A thriving and diverse economy has been conducive to housing recovery, as job and wage growth are key to new household formations and housing demand. The Minneapolis–St. Paul region has a resilient economy with a global reach, a talented workforce, top-notch schools, exposure to the growing technology and healthcare fields, and a quality of life that’s enabled one of the highest homeownership rates in the country.

The average 30-year fixed mortgage rate has declined from 4.3 percent to 3.9 percent recently, still well below its long-term average of around 8.0 percent. One additional rate hike may be in the cards this year, but the Fed is focused on unwinding its large portfolio. Additional inventory is still needed in order to offset declining affordability brought on by higher prices and interest rates.

“Keep a close eye on some of the tax reform proposals meandering through Congress,” said Kath Hammerseng, MAAR President-Elect. “Unfortunately, some of the key proposals directly harm the middle class and disincentivize homeownership while adding trillions to the debt.”
From The Skinny Blog.

Weekly Market Report

For Week Ending November 4, 2017

New tax legislation that could affect the housing market is still currently being discussed and debated by the U.S. Senate and House of Representatives, but it appears that important tools used by homeowners, like the mortgage interest deduction, are in line to continue in some capacity. This continuity would be useful for maintaining a positive outlook for residential real estate.

In the Twin Cities region, for the week ending November 4:

  • New Listings decreased 8.7% to 1,017
  • Pending Sales increased 0.8% to 1,076
  • Inventory decreased 15.3% to 11,585

For the month of September:

  • Median Sales Price increased 7.4% to $247,000
  • Days on Market decreased 12.3% to 50
  • Percent of Original List Price Received increased 0.6% to 98.1%
  • Months Supply of Inventory decreased 16.7% to 2.5

All comparisons are to 2016

Click here for the full Weekly Market Activity Report. From The Skinny Blog.

Weekly Market Report

For Week Ending October 28, 2017

The national unemployment rate registered in at 4.1 percent for October 2017. To put that in perspective, joblessness has not been this low in the U.S. since December 2000. In other positive economic news, mortgage rates have been holding steady at or near 3.9 percent. Historically, the average rate has been around 6.0 percent. Factors such as these keep the pool of potential buyers full, even during the so-called off-season of residential real estate sales.

In the Twin Cities region, for the week ending October 28:

  • New Listings increased 2.7% to 1,076
  • Pending Sales decreased 2.2% to 1,001
  • Inventory decreased 16.4% to 11,932

For the month of September:

  • Median Sales Price increased 7.4% to $247,000
  • Days on Market decreased 12.3% to 50
  • Percent of Original List Price Received increased 0.6% to 98.1%
  • Months Supply of Inventory decreased 16.7% to 2.5

All comparisons are to 2016

Click here for the full Weekly Market Activity Report. From The Skinny Blog.