By Erin Milburn on Wednesday, December 14th, 2016
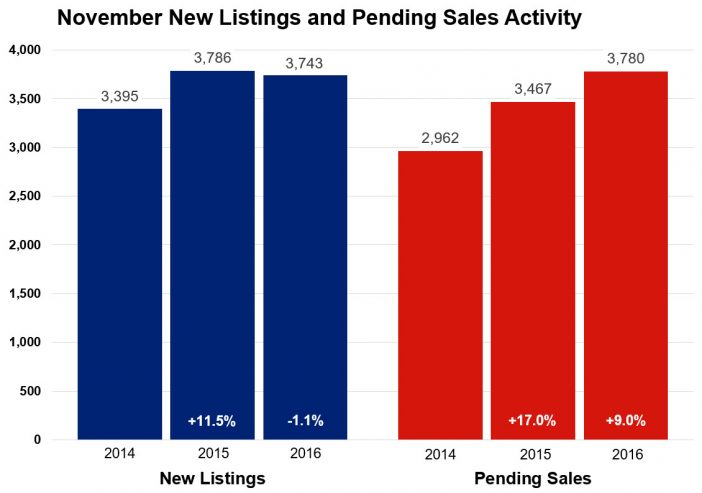
As Twin Citizens hunker down for winter, home buyers haven’t requested any time off this holiday season. Pending home sales rose 9.0 percent compared to last November and are at their highest level for any November since 2004. Closed sales likely reflect a sense of haste, as buyers closed on a whopping 25.2 percent more homes this November than last year. That represents the largest year-over-year increase in closed sales since February 2012, when closings increased 28.2 percent. Partly due to our lovely November weather, buyer activity this year fell much less from October to November than in past years.
Sellers were decidedly less optimistic about moving. Only 3,743 for-sale properties were listed on the market last month, 1.1 percent fewer than last November. Although home prices have reached their seasonal peak for the year, the median sales price increased 5.8 percent from last year to $232,000—uncharacteristically surpassing the $230,000 median price during September and October of 2016. Inventory levels dropped 22.8 percent to 10,706 active properties, which is nearing a 14-year record low. Additional listings are needed to address the current supply shortage—especially at the entry-level and first-time buyer price brackets.
Competing bids on attractive listings are common in low inventory environments, and homes tend to sell quickly for close to list price. Days on market until sale fell 16.4 percent to 61 days compared to 64 for the year so far. The average percent of original list price received at sale was 96.7 percent, 0.8 percent higher than last year. But the median percent of current list price received is 99.4 percent. Months supply of inventory fell 27.6 percent to 2.1 months—the lowest figure on record for any month since 2003. This indicator measures the balance between supply and demand in the marketplace. Generally, five to six months of supply is considered a balanced market.
“Strong buyer demand is still driving this market in a great big way,” said Judy Shields, Minneapolis Area Association of REALTORS® (MAAR) President. “While it’s not unheard of for pending sales to surpass new listings in a winter month, it is relatively uncommon.”
 While single family sales dominate the Twin Cities market by number, townhome sales showed the largest year-over-year sales increase followed by condos. Similarly, though previously-owned properties make up the largest share of sales, newly constructed properties had three times the year-over-year increase. The most active price range over the last 12 months is $190,000 to $250,000 but the largest gain in sales occurred in the $350,000 to $500,000 range.
A healthy Twin Cities labor market has been conducive to housing recovery. The most recent national unemployment rate is 4.6 percent, though it’s 3.1 percent locally. The Minneapolis–St. Paul metropolitan area has the fourth lowest unemployment rate of any major metro area.
The average 30-year fixed mortgage rate has risen to 4.13 percent, still well below a long-term average of about 8.0 percent. Marginally higher rates were widely expected in 2016, but the Federal Reserve hasn’t moved rates since last December. While “Fedspeak” is notoriously ambiguous, Chair Yellen recently gave markets an unusual amount of clarity regarding Fed policy. Expect a quarter or half point increase in the federal funds rate at their December meeting.
“Buyers are feeling the pressure to some degree but still remain sensible,” said Cotty Lowry, MAAR President-Elect. “Despite some interest rate risk and policy uncertainties moving forward, overall 2017 is expected to be another good year for housing.”
From The Skinny Blog.