Weekly Market Report

For Week Ending October 21, 2017

The level of real estate activity should subside each week for the remainder of the year. Savvy real estate professionals not only begin to plan now for another successful year next year, but they continue to track the trends to see where prices, listings and other metrics are at relative to last year and all past years of available data. Finding reliable patterns in the trends is a sure way to be of greater service to buyers and sellers. Let’s see where those trends are in our local market.

In the Twin Cities region, for the week ending October 21:

  • New Listings increased 10.5% to 1,329
  • Pending Sales decreased 4.4% to 1,016
  • Inventory decreased 17.7% to 12,042

For the month of September:

  • Median Sales Price increased 7.2% to $246,650
  • Days on Market decreased 12.3% to 50
  • Percent of Original List Price Received increased 0.6% to 98.1%
  • Months Supply of Inventory decreased 16.7% to 2.5

All comparisons are to 2016

Click here for the full Weekly Market Activity Report. From The Skinny Blog.

Weekly Market Report

For Week Ending October 14, 2017

Much was made of the homeownership rate dropping to a 50-year low last year. It was thought that tastes had changed, especially among Millennials, and that people craved more mobility through rentals and smaller, more urban homes. Then something happened earlier this year: Millennials drove up the homeownership rate. Judging by continued buyer demand well into autumn, it would seem that owning a home is still as desirable today as it was 50 years ago.

In the Twin Cities region, for the week ending October 14:

  • New Listings decreased 1.7% to 1,365
  • Pending Sales decreased 5.1% to 1,027
  • Inventory decreased 17.2% to 12,247

For the month of September:

  • Median Sales Price increased 7.2% to $246,500
  • Days on Market decreased 12.3% to 50
  • Percent of Original List Price Received increased 0.6% to 98.1%
  • Months Supply of Inventory decreased 16.7% to 2.5

All comparisons are to 2016

Click here for the full Weekly Market Activity Report. From The Skinny Blog.

Slight cool-down possible, particularly under $250,000

By Erin Milburn on Monday, October 16th, 2017

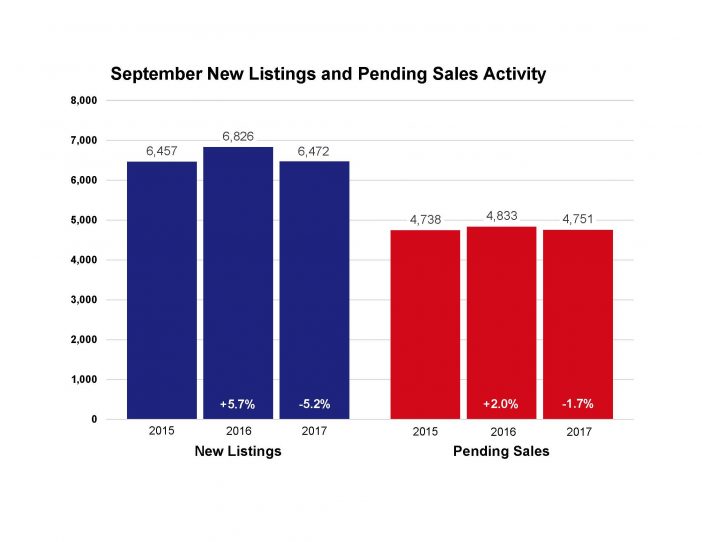
The red-hot Twin Cities housing market is starting to cool off just a bit. While June 2017 marked an all-time record for Twin Cities home sales and prices, purchase demand declined from last year for a third consecutive month. New listings decreased 5.2 percent from September 2016 to 6,472, and pending sales dipped 1.7 percent. The number of homes for sale decreased 16.7 percent to 12,502. Excluding the limited number of foreclosures and short sales, traditional new listings fell 3.6 percent while traditional pending sales increased 0.1 percent.

Since competition over limited supply remains intense, prices kept firm. The median sales price rose 7.3 percent from last year to $246,900. Home prices have now risen for the last 67 consecutive months or over 5.5 years. At 50 days on average, homes went under contract 12.3 percent faster than last September. Sellers who choose to list their properties are averaging 98.1 percent of their original list price, 0.6 percent higher than September 2016. The metro area has just 2.5 months of housing supply. Generally, five to six months of supply is considered a balanced market where neither buyers nor sellers have a clear advantage.

“There’s no other way to say it: sentiment out there may be starting to change,” said Cotty Lowry, Minneapolis Area Association of REALTORS® (MAAR) President. “Sometimes shifting markets can bring out a lot of pessimism, which can become a self-fulfilling prophecy. The likely scenario may be a brief pause in the trend we’ve seen. That’s not a bad thing, since it allows incomes a chance to catch up and takes the intensity down a notch.
Sept-2017-PR-Image-702x542”Sometimes market-wide figures mask important segment-specific realities and other indicators that buyers and sellers should be aware of. For example, closed sales only fell for homes under $250,000. Sales increased for homes priced between $250,000 and $500,000, $500,000 and $1,000,000 and for properties over $1,000,000. Market times and the ratio of sales price to list price both improved for each of the above four price ranges.

The most recent national unemployment rate is 4.4 percent, though it’s 3.4 percent locally—the third lowest unemployment rate of any major metro area. A thriving and diverse economy has been conducive to housing recovery, as job and wage growth are key to new household formations and housing demand. The Minneapolis–St. Paul region has a resilient economy with a global reach, a talented workforce, top-notch schools, exposure to the growing technology and healthcare fields, and a quality of life that’s enabled one of the highest homeownership rates in the country.

The average 30-year fixed mortgage rate has declined from 4.3 percent to 3.8 percent recently, still well below its long-term average of around 8.0 percent. One additional rate hike may be in the cards this year, but the Fed is focused on unwinding its large portfolio. Additional inventory is still needed in order to offset declining affordability brought on by higher prices and interest rates.

“Throughout the recovery, the affordable end of the market has been the focus,” said Kath Hammerseng, MAAR President-Elect. “For homes above $250,000, the market is better supplied, less competitive and is still expanding—it’s really the bottom-end of the market that’s feeling the most inventory and therefore sales pressure.”
From The Skinny Blog.

Weekly Market Report

For Week Ending October 7, 2017

Many potential buyers are simply not on the market during this time of year, as school-aged children settle into routines and the gainfully employed focus more on end-of-year goals and holiday planning over taking on a big move. But not all buyers are equal. Consider instead the first-time buyers with no children, relocated employees, investment buyers, bargain hunters and those with generally fewer ties to established routines.

In the Twin Cities region, for the week ending October 7:

  • New Listings decreased 1.3% to 1,395
  • Pending Sales increased 4.1% to 1,103
  • Inventory decreased 16.6% to 12,378

For the month of September:

  • Median Sales Price increased 7.3% to $246,800
  • Days on Market decreased 12.3% to 50
  • Percent of Original List Price Received increased 0.6% to 98.1%
  • Months Supply of Inventory decreased 16.7% to 2.5

All comparisons are to 2016

Click here for the full Weekly Market Activity Report. From The Skinny Blog.

Weekly Market Report

For Week Ending September 30, 2017

Few cities and neighborhoods – around the nation and locally – are turning heads as hotbeds of new housing inventory. Residential real estate markets that have had a hard time dealing with a reduction in the number of homes available for sale are now also struggling to keep up with new listings levels from last year. While it’s true that builder confidence is up, it will take time before any sort of new development spawns a significant change in trend direction.

In the Twin Cities region, for the week ending September 30:

  • New Listings decreased 4.9% to 1,382
  • Pending Sales decreased 0.9% to 1,160
  • Inventory decreased 16.0% to 12,728

For the month of August:

  • Median Sales Price increased 6.8% to $252,000
  • Days on Market decreased 14.3% to 48
  • Percent of Original List Price Received increased 0.6% to 98.5%
  • Months Supply of Inventory decreased 16.7% to 2.5

All comparisons are to 2016

Click here for the full Weekly Market Activity Report. From The Skinny Blog.

Weekly Market Report

For Week Ending September 23, 2017

Last year’s national chorus was about how high buyer demand, a sunny economic outlook and enticingly low mortgage rates were propping up sales and prices in spite of low inventory. That refrain is still common enough, but regional changes continue to become more pronounced, whether due to weather, differing employment expectations or varying new construction outlooks. Let’s look at how our unique local market is performing.

In the Twin Cities region, for the week ending September 23:

  • New Listings increased 1.7% to 1,465
  • Pending Sales decreased 1.5% to 1,081
  • Inventory decreased 16.5% to 12,740

For the month of August:

  • Median Sales Price increased 6.8% to $252,000
  • Days on Market decreased 14.3% to 48
  • Percent of Original List Price Received increased 0.6% to 98.5%
  • Months Supply of Inventory decreased 16.7% to 2.5

All comparisons are to 2016

Click here for the full Weekly Market Activity Report. From The Skinny Blog.