Weekly Market Report

For Week Ending April 21, 2018

After at least two years of hearing reports that both sellers and builders are gaining in confidence due to an expected positive return on investment, we are starting to see some upward movement in the New Listings metric locally and throughout the nation. Although there may not necessarily be positives from week to week, a longer-term improvement trend would not be a surprise at this point.

In the Twin Cities region, for the week ending April 21:

  • New Listings decreased 19.4% to 1,669
  • Pending Sales decreased 12.6% to 1,296
  • Inventory decreased 23.3% to 8,899

For the month of March:

  • Median Sales Price increased 9.8% to $258,000
  • Days on Market decreased 21.9% to 57
  • Percent of Original List Price Received increased 1.1% to 99.1%
  • Months Supply of Inventory decreased 22.7% to 1.7

All comparisons are to 2017

Click here for the full Weekly Market Activity Report. From The Skinny Blog.

Weekly Market Report

For Week Ending April 14, 2018

One begins to wonder just how long the housing market can work in the favor of sellers. Low inventory continues to create a competitive situation for buyers that has sales prices meeting asking prices and often going over for well-priced homes that show well. As long as buyers continue to form new households and feel financially confident within an inviting economy, this could be the state of residential real estate for quite some time.

In the Twin Cities region, for the week ending April 14:

  • New Listings decreased at 1,653
  • Pending Sales decreased 14.0% to 1,258
  • Inventory decreased 24.2% to 8,752

For the month of March:

  • Median Sales Price increased 9.8% to $258,000
  • Days on Market decreased 21.9% to 57
  • Percent of Original List Price Received increased 1.1% to 99.1%
  • Months Supply of Inventory decreased 22.7% to 1.7

All comparisons are to 2017

Click here for the full Weekly Market Activity Report. From The Skinny Blog.

Mixed Spring: Activity cools while prices, market times remain hot

By David Arbit on Wednesday, April 18th, 2018

From colder-than-average temperatures to a record-breaking snow storm, this spring has been anything but normal. While those searching for homes have seen more options since January or February, they’re still seeing fewer options compared to last year. That’s capped sales activity—particularly at the entry-level prices—and the lack of inventory combined with rising prices is encouraging some sellers to hold onto their properties.

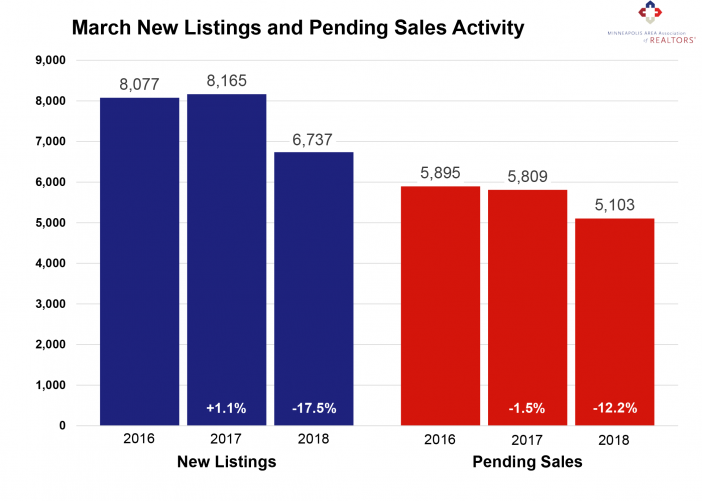
In March, sellers listed 17.5 percent fewer homes on the market—the fifth consecutive month of declines compared to a year ago. Largely due to the shortage, closed sales declined 10.3 percent compared to the year prior. For-sale housing inventory was 26.1 percent lower than March 2017, the largest decline in over a year. This shortage has created a competitive environment where multiple offers and homes selling for over list price have become more common.

Sellers are receiving strong offers close to their original list price quickly, which can sometimes frustrate home buyers. New construction closed sales rose 13.1 percent compared to last March. Although single family homes made up about 74.0 percent of all sales, townhomes have enjoyed more resilient demand lately. Similarly, previously-owned homes made up about 89.0 percent of sales but new construction showed a much stronger increase in pending and closed purchase activity.

“We’re seeing some early evidence that the seller’s market could be starting to shift toward a balanced market,” said Kath Hammerseng, President of the Minneapolis Area Association of REALTORS® (MAAR), “When it comes to the long-term health of the housing market, that’s very much a good thing.”

March 2018 by the Numbers (compared to a year ago)

  • Sellers listed 6,737 properties on the market, a 17.5 percent decrease
  • Buyers closed on 3,978 homes, a 10.3 percent decrease
  • Inventory levels for March fell 26.1 percent compared to 2017 to 8,289 units
  • Months Supply of Inventory was down 22.7 percent to 1.7 months
  • The Median Sales Price rose 9.8 percent to $258,000, a record high for March
  • Cumulative Days on Market declined 21.9 percent to 57 days, on average (median of 22)
  • Changes in Sales activity varied by market segment:
    • Single family sales fell 9.8 percent; condo sales declined 10.0 percent; townhome sales shrank 9.6 percent
    • Traditional sales fell 7.5 percent; foreclosure sales decreased 39.3 percent; short sales fell 47.3 percent
    • Previously-owned sales fell 11.4 percent; new construction sales rose 13.1 percent

    “Prices continue to rise while market times remain brisk,” said Todd Urbanski, President-Elect of MAAR. “This spring market is shaping to be more buyer-friendly than last year, it’s still a great time to get properties listed.”

    From The Skinny Blog.

Weekly Market Report

For Week Ending April 7, 2018

The spring of 2018 has exhibited weather patterns that many will not soon forget. Professional baseball games are getting canceled due to snow, vacations are being delayed by grounded flights and the usual rush that takes place in the housing market when the names of months get shorter is maintaining a more even pace. Given continued heightened buyer demand brought on by more household formations and higher wages, temperance may well be a good thing for market health.

In the Twin Cities region, for the week ending April 7:

  • New Listings decreased 5.8% to 1,941
  • Pending Sales decreased 11.7% to 1,230
  • Inventory decreased 24.9% to 8,365

For the month of March:

  • Median Sales Price increased 9.8% to $258,000
  • Days on Market decreased 21.9% to 57
  • Percent of Original List Price Received increased 1.1% to 99.1%
  • Months Supply of Inventory decreased 22.7% to 1.7

All comparisons are to 2017

Click here for the full Weekly Market Activity Report. From The Skinny Blog.

Weekly Market Report

For Week Ending March 31, 2018

Climbing out of winter has taken more time than usual for much of the U.S., but house hunting should finally be taking center stage for many buyers. Quickly assessing what’s available for sale will be key for buyers in what is sure to be another competitive selling season. Buyers and sellers must watch for further mortgage rate increases and volatile economic indicators like a jumpy stock market and chilly relations with international trade partners, which can cause shifts in local housing markets.

In the Twin Cities region, for the week ending March 31:

  • New Listings decreased 35.2% to 1,234
  • Pending Sales decreased 19.2% to 1,124
  • Inventory decreased 23.0% to 8,397

For the month of February:

  • Median Sales Price increased 12.7% to $250,000
  • Days on Market decreased 15.9% to 69
  • Percent of Original List Price Received increased 1.6% to 98.0%
  • Months Supply of Inventory decreased 15.8% to 1.6

All comparisons are to 2017

Click here for the full Weekly Market Activity Report. From The Skinny Blog.

Weekly Market Report

For Week Ending March 24, 2018

In general, housing markets are performing rather well across the country and locally. While some measures may show year-over-year declines at times, the truth of the matter is that showings are plentiful, buyers are eagerly searching for homes to purchase and good properties are exchanging hands whether or not the overall inventory situation is less than favorable or mortgage rates go up a quarter percent.

In the Twin Cities region, for the week ending March 24:

  • New Listings decreased 1.9% to 1,586
  • Pending Sales decreased 12.4% to 1,197
  • Inventory decreased 23.2% to 8,290

For the month of February:

  • Median Sales Price increased 12.7% to $250,000
  • Days on Market decreased 15.9% to 69
  • Percent of Original List Price Received increased 1.6% to 98.0%
  • Months Supply of Inventory decreased 15.8% to 1.6

All comparisons are to 2017

Click here for the full Weekly Market Activity Report. From The Skinny Blog.