Weekly Market Report

For Week Ending September 21, 2019

This week the National Association of REALTORS® reported that nationally, August existing-home sales rose 2.6% from a year ago. Additionally, the Federal Reserve announced a rate cut for the second time in seven weeks, though this was widely expected and largely factored into mortgage rates already. A strong economy along with mortgage rates near their lows for the year continue to support healthy housing demand.

In the Twin Cities region, for the week ending September 21:

  • New Listings increased 7.6% to 1,676
  • Pending Sales decreased 2.4% to 1,158
  • Inventory decreased 4.4% to 12,628

For the month of August:

  • Median Sales Price increased 6.9% to $286,500
  • Days on Market increased 2.5% to 41
  • Percent of Original List Price Received decreased 0.2% to 99.0%
  • Months Supply of Homes For Sale remained flat at 2.6

All comparisons are to 2018

Click here for the full Weekly Market Activity Report. From MAAR Market Data News.

Weekly Market Report

For Week Ending September 14, 2019

With kids back in school and the weather beginning to cool, the housing market begins its annual cooldown as well. With buyer and seller activity remaining strong, it will be at a little more relaxed pace than during the late spring and summer. While Halloween decorations may be adorning stores and soon adorn the stoops of homes around the country, the real estate market this fall is looking far from scary.

In the Twin Cities region, for the week ending September 14:

  • New Listings decreased 1.3% to 1,820
  • Pending Sales decreased 7.8% to 1,144
  • Inventory decreased 4.8% to 12,423

For the month of August:

  • Median Sales Price increased 6.7% to $286,000
  • Days on Market increased 2.5% to 41
  • Percent of Original List Price Received decreased 0.2% to 99.0%
  • Months Supply of Homes For Sale decreased 3.8% to 2.5

All comparisons are to 2018

Click here for the full Weekly Market Activity Report. From MAAR Market Data News.

Things still feeling pretty stable out there, thanks for asking

September 18, 2019

With two-thirds of the year in the books, we’re getting a clearer picture of where the housing market stands. The latest numbers for Twin Cities residential real estate show stability along with signs of deceleration. The median sales price continued to rise, landing at $286,800 for the month. Pending sales—a measure of signed contracts and future demand—rose 3.2 percent but are down slightly for the year so far. New listings slipped 2.0 percent, thwarting some buyers’ hopes of taking advantage of historically low rates. Closed sales were down 0.9 percent for the month and are down 1.4 percent for the year. One sign of market shift is days on market, which rose 2.5 percent year-over-year. Market times remain swift, but that’s the fourth year-over-year increase this year. Another sign of a changing market is the ratio of sold to list price. Sellers have been accepting a slightly lower share of their list price compared to the year prior for seven of the last eight months. This, along with other indicators, suggests the market is rebalancing. The landscape seems to be improving for buyers, even though sellers still have strong pricing power, favorable negotiating leverage and quick market times.

The number of active listings for sale has been rising this year. Even so, the market remains tight—particularly for first-time buyers and downsizers competing in the sub-$300,000 segment where multiple offers and homes selling for over list price are commonplace. With just 2.5 months of supply, the Twin Cities is still significantly undersupplied. The move-up and upper-bracket segments are less competitive and better supplied. Given some of the recent economic uncertainty, it’s worth noting that the Twin Cities market is well-positioned to withstand an economic downturn.

August 2019 by the Numbers (compared to a year ago)

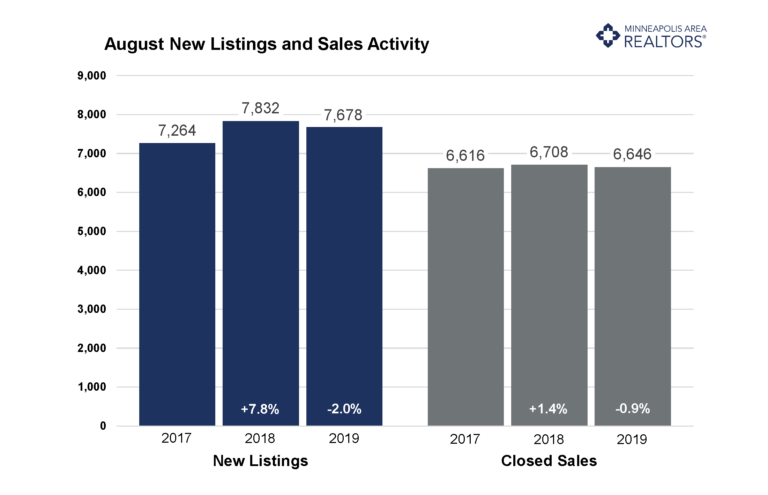
Sellers listed 7,678 properties on the market, a 2.0 percent decrease from last August
Buyers closed on 6,646 homes, a 0.9 percent decrease
Inventory levels decreased 5.5 percent from last August to 12,238 units
Months Supply of Inventory was down 3.8 percent to 2.5 months
The Median Sales Price rose 7.0 percent to $286,800, a record high for August
Cumulative Days on Market rose 2.5 percent to 41 days, on average (median of 21)
Changes in Sales activity varied by market segment

Single family sales rose 1.4 percent; condo sales decreased 6.2 percent; townhome sales fell 7.8 percent
Traditional sales increased 0.1 percent; foreclosure sales dropped 40.9 percent; short sales fell 45.5 percent
Previously owned sales were down 0.1 percent; new construction sales declined 5.0 percent

Quotables

“Some think the fall market isn’t for them, but tight conditions and favorable rates suggest momentum moving into 2020,” said Todd Urbanski, President of Minneapolis Area REALTORS®. “We’re at a moment when sellers are enjoying their position while buyers are taking advantage of lower than expected interest rates and more options.”

“Most markets remain stable across the metro,” said Linda Rogers, President-Elect of Minneapolis Area REALTORS®. “While there is a good amount of local variation, we just don’t see that many signs for concern.”
From The Skinny Blog.

Weekly Market Report

For Week Ending September 7, 2019

The White House has released a plan to broadly overhaul the housing finance system, including the re-privatization of Fannie Mae and Freddie Mac and reforms to federal agencies involved with financing substantial portions of the mortgages made every year. These changes will affect the cost and availability of loans in the future. Many recommendations will require legislative approval, so it is unclear at this time how much of the plan may eventually be implemented and its ultimate impact on the housing market.

In the Twin Cities region, for the week ending September 7:

  • New Listings decreased 3.8% to 1,691
  • Pending Sales increased 5.3% to 1,113
  • Inventory decreased 4.5% to 12,224

For the month of August:

  • Median Sales Price increased 6.7% to $286,000
  • Days on Market increased 2.5% to 41
  • Percent of Original List Price Received decreased 0.2% to 99.0%
  • Months Supply of Homes For Sale decreased 3.8% to 2.5

All comparisons are to 2018

Click here for the full Weekly Market Activity Report. From MAAR Market Data News.

Weekly Market Report

For Week Ending August 31, 2019

Recent mortgage rate declines may provide a small tailwind as we enter the fall housing market, giving buyers a bit more buying power and a little more incentive to lock in a home purchase. However, stock market volatility and concern of a wider economic slowdown in the coming year may temper some buyer enthusiasm. But as rents continue to rise, the value proposition of owning a home remains a compelling option and a goal of most Americans.

In the Twin Cities region, for the week ending August 31:

  • New Listings increased 4.9% to 1,359
  • Pending Sales decreased 3.1% to 1,250
  • Inventory decreased 4.4% to 12,498

For the month of July:

  • Median Sales Price increased 5.9% to $283,900
  • Days on Market remained flat at 38
  • Percent of Original List Price Received decreased 0.1% to 99.7%
  • Months Supply of Homes For Sale remained flat at 2.5

All comparisons are to 2018

Click here for the full Weekly Market Activity Report. From MAAR Market Data News.

Weekly Market Report

For Week Ending August 24, 2019

Lack of affordable inventory has been a key story in real estate in the last few years. There is a growing consensus suggesting the U.S. economy could be entering a recession, and some wonder whether this could lead to an adjustment in housing prices. However, this scenario is unlikely to make housing more affordable, as economic uncertainty is likely to discourage first-time home buyers and could make construction companies leary of building new homes.

In the Twin Cities region, for the week ending August 24:

  • New Listings decreased 1.5% to 1,664
  • Pending Sales increased 1.9% to 1,253
  • Inventory decreased 3.9% to 12,501

For the month of July:

  • Median Sales Price increased 5.8% to $283,420
  • Days on Market remained flat at 38
  • Percent of Original List Price Received decreased 0.1% to 99.7%
  • Months Supply of Homes For Sale remained flat at 2.5

All comparisons are to 2018

Click here for the full Weekly Market Activity Report. From MAAR Market Data News.