Weekly Market Report

Gains in construction activity and job growth have made the Fed confident that moderate bond tapering won’t rock the resilient real estate market. Holiday happenings have bolstered an already healthy economy. And though winter vacation jubilee may accentuate seasonally lazy home sales, most local markets should show cozy year-over-year comparisons.

In the Twin Cities region, for the week ending December 21:

  • New Listings decreased 15.3% to 558
  • Pending Sales decreased 11.0% to 689
  • Inventory decreased 7.3% to 13,283

For the month of November:

  • Median Sales Price increased 13.4% to $195,000
  • Days on Market decreased 26.5% to 75
  • Percent of Original List Price Received increased 1.3% to 95.4%
  • Months Supply of Inventory decreased 11.1% to 3.2

All comparisons are to 2012

Click here for the full Weekly Market Activity Report.From The Skinny.

Weekly Market Report

A plethora of economic data was recently released, and it shows that exports rose
to their highest level ever while job growth numbers have surpassed even the most hopeful Wall Street expectations. But good news isn’t always good news, since this means that the Fed is going to begin tapering its historic bond-buying activity as the economy heals. Stocks may take a dip. But, with some luck, the demand-side effect of the impending rate increase could be offset by stronger economic fundamentals that should keep the housing market humming along.

In the Twin Cities region, for the week ending December 14:

  • New Listings decreased 1.9% to 759
  • Pending Sales decreased 11.1% to 656
  • Inventory decreased 6.5% to 13,728

For the month of November:

  • Median Sales Price increased 13.4% to $195,000
  • Days on Market decreased 26.5% to 75
  • Percent of Original List Price Received increased 1.3% to 95.4%
  • Months Supply of Inventory decreased 11.1% to 3.2

All comparisons are to 2012

Click here for the full Weekly Market Activity Report.From The Skinny.

Weekly Market Report

The first week in December this year was filled with Black Friday and Cyber
Monday deals – this means more people were clamoring in line at 2:00 a.m.
waiting for a Suzie-Talks-A-Lot than were attending open houses. Seasonal trends
should be evident in a slight market slowdown, but year-over-year comparisons
will still brighten any burgeoning bah-humbuggers.

In the Twin Cities region, for the week ending December 7:

  • New Listings decreased 5.7% to 887
  • Pending Sales increased 0.9% to 751
  • Inventory decreased 5.6% to 14,043

For the month of November:

  • Median Sales Price increased 13.4% to $195,000
  • Days on Market decreased 26.5% to 75
  • Percent of Original List Price Received increased 1.3% to 95.4%
  • Months Supply of Inventory decreased 11.1% to 3.2

All comparisons are to 2012

Click here for the full Weekly Market Activity Report.From The Skinny.

Lighter Foreclosure and Short Sale Load Continues to Help the Market

6a00e54ee9620b8834019b029cac33970c-800wiThe 13-county Minneapolis-St. Paul metropolitan area housing market continued to settle itself in November. While some measures of housing demand may suggest a slowdown, most deceleration is the result of a healing lender-mediated (foreclosures and short sales) segment, which made up a smaller share of the residential pie compared to last year.

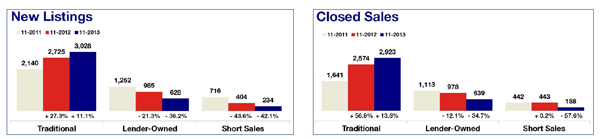
For the first time in seven months, new listings were lower year over year, declining 5.3 percent to 3,900, but traditional new listings rose 11.1 percent over the same time comparison. Buyers closed on 3,760 homes, a 5.9 percent decrease from last November, even though traditional sales were up 13.6 percent. Twin Citizens have 14,126 properties to choose from – or 5.8 percent fewer than last November.

The market-wide median sales price held steady at $195,000 for a third straight month and up 13.4 percent compared to November 2012. Last year, foreclosures and short sales comprised 35.6 percent of all closed sales. In November 2013, these segments made up only 22.1 percent of all sales.

“We are seeing exactly what we want to be seeing,” said Andy Fazendin, President of the Minneapolis Area Association of REALTORS® (MAAR). “Lender-mediated activity once commanded heavy market share, and residential real estate is going to be stronger with fewer foreclosure and short sale properties in the system.”

Traditional new listings rose 11.1 percent, but foreclosure and short sale new listings fell 36.2 and 42.1 percent, respectively. Traditional closed sales rose 13.6 percent; foreclosure and short sale closings fell 34.7 and 57.6 percent. Traditional homes are selling at a median price of $217,000; foreclosures for $133,851; short sales for $150,000.

On average, homes are spending 75 days on the market – quite brisk relative to the past several years. Sellers are receiving an average of 95.4 percent of their original list price – the highest November ratio since 2005. The Twin Cities metro now has 3.2 months’ supply of inventory, which suggests sellers have regained their leverage.

“Some might claim that the recovery is stalling, but the reality is that job growth is gaining momentum and there are fewer distressed properties being listed and sold than at any point in the past five years.” said Emily Green, MAAR President-Elect. “We could stand to see this trend continue into 2014.”

Weekly Market Report

The calendar can sometimes have just as profound an effect on housing data as
supply and demand. The 2013 Thanksgiving holiday was a week later than in
2012, causing some peculiar shifts in activity. This serves as a good reminder to
watch for calendar oddities just as much as you do economic indicators. Even so,
aside from family time and tryptophan, buyers and sellers had a lot to be grateful
for this Thanksgiving. Buyers still live in a time of great affordability, and sellers
should be thankful for shorter market times, higher prices and less competition.

In the Twin Cities region, for the week ending November 30:

  • New Listings decreased 47.0% to 540
  • Pending Sales decreased 38.5% to 579
  • Inventory decreased 4.5% to 14,582

For the month of November:

  • Median Sales Price increased 13.4% to $195,000
  • Days on Market decreased 26.5% to 75
  • Percent of Original List Price Received increased 1.3% to 95.4%
  • Months Supply of Inventory decreased 11.1% to 3.2

All comparisons are to 2012

Click here for the full Weekly Market Activity Report.From The Skinny.

Weekly Market Report

As the end of the year approaches, market futurists will either put on their overly cheery, poinsettia-colored glasses or turn into a bunch of dreary Nostradamus Nellys. The wise analyst will tune out extremes and embrace seasonally appropriate slowdowns as a sign of normal market activity while looking with anticipation to what will likely be continued moderate recovery in 2014. Watch for light gains in inventory, quieter pending sales activity and more sedate market times.

In the Twin Cities region, for the week ending November 23:

  • New Listings increased 46.6% to 893
  • Pending Sales increased 42.8% to 841
  • Inventory decreased 3.6% to 15,008

For the month of October:

  • Median Sales Price increased 11.4% to $194,900
  • Days on Market decreased 27.2% to 75
  • Percent of Original List Price Received increased 1.4% to 95.8%
  • Months Supply of Inventory decreased 10.0% to 3.6

All comparisons are to 2012

Click here for the full Weekly Market Activity Report.From The Skinny.