Weekly Market Report


For Week Ending November 21, 2020

The National Association of REALTORS® reported that existing-home sales rose again in October, the fifth monthly increase in a row. Total existing-home sales increased 4.3% from September, rising to a seasonally adjusted annual rate of 6.85 million homes, and marking the highest home sales level in 15 years. While home sales activity slows during the holiday season, overall buyer demand remains strong.

In the Twin Cities region, for the week ending November 21:

  • New Listings increased 5.2% to 990
  • Pending Sales increased 8.8% to 1,093
  • Inventory decreased 33.5% to 7,604

For the month of October:

  • Median Sales Price increased 12.5% to $315,000
  • Days on Market decreased 23.9% to 35
  • Percent of Original List Price Received increased 2.4% to 100.5%
  • Months Supply of Homes For Sale decreased 36.0% to 1.6

All comparisons are to 2019

Click here for the full Weekly Market Activity Report. From MAAR Market Data News.

Weekly Market Report


For Week Ending November 14, 2020

The Mortgage Bankers Association reported this week that mortgage credit availability increased in October, the first increase since July. Increasing credit availability means that lending standards are loosening, albeit slightly. Overall, credit availability increased for low credit scores and higher LTV loans, with convention credit supply increasing 5.1 percent, while government credit supply was effectively flat. Although the October increase was welcome news, credit availability remains near lows last seen in 2014.

In the Twin Cities region, for the week ending November 14:

  • New Listings decreased 6.3% to 981
  • Pending Sales increased 4.8% to 1,096
  • Inventory decreased 32.3% to 8,004

For the month of October:

  • Median Sales Price increased 12.5% to $315,000
  • Days on Market decreased 23.9% to 35
  • Percent of Original List Price Received increased 2.4% to 100.5%
  • Months Supply of Homes For Sale decreased 36.0% to 1.6

All comparisons are to 2019

Click here for the full Weekly Market Activity Report. From MAAR Market Data News.

Weekly Market Report


For Week Ending November 7, 2020

Realtor.com reported this week that, nationally, the inventory of homes for sale in October declined 38.3% from October 2019, continuing the long-term trend of limited housing availability. Continued buyer interest along with a limited supply of inventory are extending the season of multiple offers on hot properties into what is normally the slower selling season.

In the Twin Cities region, for the week ending November 7:

  • New Listings increased 11.9% to 1,235
  • Pending Sales increased 18.5% to 1,222
  • Inventory decreased 31.4% to 8,298

For the month of October:

  • Median Sales Price increased 12.5% to $315,000
  • Days on Market decreased 23.9% to 35
  • Percent of Original List Price Received increased 2.4% to 100.5%
  • Months Supply of Homes For Sale decreased 36.0% to 1.6

All comparisons are to 2019

Click here for the full Weekly Market Activity Report. From MAAR Market Data News.

Sales outpacing supply, prices accelerate, core cities remain strong

New listings and sales up, price growth accelerating, but supply levels extremely low

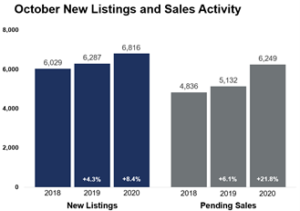
(November 19, 2020) – According to new data from the Minneapolis Area REALTORS® and the Saint Paul Area Association of REALTORS®, buyer and seller activity in the 16-county Twin Cities metro continue to outpace 2019. Seller activity rose 8.4 percent compared to last October while buyer activity was up 21.8 percent, marking the strongest October sales figure since at least 2003.

Buyers are motivated by expectations of working and spending more time at home and are also buoyed by historically low interest rates. That has resulted in a highly competitive marketplace where sellers get strong offers—sometimes above asking price—in record time and often with multiple offers. It has also caused inventory levels to plummet, frustrating many buyers.

“Buyers are still out in force, which is fairly unusual for this time of year when things typically quiet down,” according to Patrick Ruble, President of the Saint Paul Area Association of REALTORS®. “But the shortage of inventory and fast pace of the market are still keeping some waiting in the wings.”

Record-low mortgage rates, a desire for more space, a shortage of listings and Millennials aging into homeownership have all led to record-setting demand and rising prices among other changes. This is unusual during a recession, which impacts people differently. The mid-market move-up ranges and luxury segments have been performing better as salaried professionals have been spared much of the hardship. Conversely, many would-be buyers in the most affordable price points have been sidelined as they’re more likely to be impacted by job or income loss.

Still firmly in the driver’s seat, sellers, on average, accepted offers at 100.5 percent of their original list price—matching a high for any month going back to at least 2003. At 35 days on average, homes across the metro sold 23.9 percent quicker than last October.

“Despite some earlier challenges, Minneapolis and St. Paul are still seeing strong sales growth,” said Linda Rogers, President of Minneapolis Area REALTORS®. “They’re still quite competitive.”

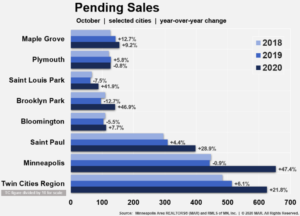
For example, new listings rose 35.5 percent in Minneapolis and 22.8 percent in St. Paul while sales were up 47.4 and 28.9 percent, respectively. Demand in the core cities is once again outpacing supply. Downtown condos are still an area of weakness, but metro-wide sales of homes priced over $1M are up over 98.0 percent from last October.

October 2020 by the numbers compared to a year ago

  • Sellers listed 6,816 properties on the market, an 8.4 percent increase from last October
  • Buyers signed 6,249 purchase agreements, up 21.8 percent (6,674 closed sales, up 22.3 percent)
  • Inventory levels fell 34.5 percent to 8,080 units
  • Months Supply of Inventory was down 40.0 percent to5 months (5-6 months is balanced)
  • The Median Sales Price rose 12.5 percent to $315,000
  • Days on Market decreased 23.9 percent to 35 days, on average (median of 14, down 44.0 percent)
  • Changes in Sales activity varied by market segment
    • Single family sales were up 24.07percent; condo sales rose 8.6 percent; townhome sales increased 17.6 percent
    • Traditional sales rose 22.3 percent; foreclosure sales were down 20.4 percent; short sales fell 6.7 percent
    • Previously owned sales were up 20.1 percent; new construction sales climbed 43.4 percent

All information is according to the Minneapolis Area REALTORS® and Saint Paul Area Association of REALTORS based on data from NorthstarMLS. We serve the Twin Cities 16-county metro area and western Wisconsin.

Weekly Market Report


For Week Ending October 31, 2020

The U.S. Bureau of Economic Analysis released its estimate for the country’s Q3 2020 GDP, showing the U.S. gross domestic product grew at an annualized rate of 33.1% in the third quarter, reversing much of the decline from COVID-19 seen from the second quarter. However, economists caution it may take a year or more for the gross domestic product to reach its previous highs.

In the Twin Cities region, for the week ending October 31:

  • New Listings decreased 6.4% to 1,161
  • Pending Sales increased 14.7% to 1,246
  • Inventory decreased 32.5% to 8,450

For the month of September:

  • Median Sales Price increased 10.8% to $310,000
  • Days on Market decreased 15.9% to 37
  • Percent of Original List Price Received increased 2.0% to 100.5%
  • Months Supply of Homes For Sale decreased 33.3% to 1.8

All comparisons are to 2019

Click here for the full Weekly Market Activity Report. From MAAR Market Data News.

Weekly Market Report


For Week Ending October 24, 2020

Freddie Mac reported that the 30-year fixed-rate mortgage hit a new all-time low this week, dropping to an average of 2.8% with .6 points. Record-low rates, coupled with continued strong buyer demand seen in recent months, should continue to support an active market in the coming weeks in what is normally a slower time of year.

In the Twin Cities region, for the week ending October 24:

  • New Listings increased 8.1% to 1,361
  • Pending Sales increased 27.0% to 1,422
  • Inventory decreased 29.7% to 8,971

For the month of September:

  • Median Sales Price increased 10.8% to $310,000
  • Days on Market decreased 15.9% to 37
  • Percent of Original List Price Received increased 2.0% to 100.5%
  • Months Supply of Homes For Sale decreased 33.3% to 1.8

All comparisons are to 2019

Click here for the full Weekly Market Activity Report. From MAAR Market Data News.