Weekly Market Report

For Week Ending January 2, 2021

The New Year has begun and with it, many buyers and sellers have a change of housing in their new year resolutions. While ongoing unemployment claims are still elevated, it is less than one quarter of what it was at its high during the early days of the pandemic. With interest rates remaining near record lows, the stock market near record highs, and inventory of homes available still constrained in most segments of the market, the year is setting up to be another filled with strong demand and limited supply.

In the Twin Cities region, for the week ending January 2:

  • New Listings decreased 25.8% to 519
  • Pending Sales increased 17.0% to 653
  • Inventory decreased 38.1% to 5,511

For the month of November:

  • Median Sales Price increased 10.7% to $310,000
  • Days on Market decreased 33.3% to 34
  • Percent of Original List Price Received increased 2.8% to 100.2%
  • Months Supply of Homes For Sale decreased 40.9% to 1.3

All comparisons are to 2020

Click here for the full Weekly Market Activity Report. From MAAR Market Data News.

Weekly Market Report

For Week Ending December 26, 2020

As we near the end of the year, overall real estate activity slows as many buyers and sellers briefly turn their focus from real estate to the holidays, family, and friends. With mortgage rates closing the year at near record lows, and almost one percent lower than a year ago, home purchase mortgage loan application volume remains high and continues to signal strong buyer demand going into the new year.

In the Twin Cities region, for the week ending December 26:

  • New Listings increased 22.0% to 338
  • Pending Sales increased 17.0% to 593
  • Inventory decreased 37.9% to 5,777

For the month of November:

  • Median Sales Price increased 10.7% to $310,000
  • Days on Market decreased 33.3% to 34
  • Percent of Original List Price Received increased 2.8% to 100.2%
  • Months Supply of Homes For Sale decreased 40.9% to 1.3

All comparisons are to 2019

Click here for the full Weekly Market Activity Report. From MAAR Market Data News.

Weekly Market Report

For Week Ending December 19, 2020

According to research by realtor.com®, all-cash home purchases make up about 36% of the market, which is up only slightly from last year. While the middle-price tiers saw about the same percentage of all-cash sales as last year, the low end of the market (under $200,000) and the very top of the market (over $1 million) saw higher shares of cash sales this year than last.

In the Twin Cities region, for the week ending December 19:

  • New Listings increased 28.1% to 693
  • Pending Sales increased 24.4% to 923
  • Inventory decreased 37.0% to 6,137

For the month of November:

  • Median Sales Price increased 10.7% to $310,000
  • Days on Market decreased 33.3% to 34
  • Percent of Original List Price Received increased 2.8% to 100.2%
  • Months Supply of Homes For Sale decreased 38.1% to 1.3

All comparisons are to 2019

Click here for the full Weekly Market Activity Report. From MAAR Market Data News.

Weekly Market Report

For Week Ending December 12, 2020

The National Association of Home Builders reports that lumber prices are rising again. After hitting an all-time high of near $950 per thousand board feet in September, prices slid to near $550 per thousand board feet in October but are now above $650 per thousand board feet in December. High lumber prices have contributed to significant price increases in most new construction homes this year and increases the costs of remodeling as well. A tariff reduction expected this month may help soften lumber costs in the coming weeks.

In the Twin Cities region, for the week ending December 12:

  • New Listings increased 23.6% to 870
  • Pending Sales increased 10.0% to 838
  • Inventory decreased 36.5% to 6,421

For the month of November:

  • Median Sales Price increased 10.7% to $310,000
  • Days on Market decreased 33.3% to 34
  • Percent of Original List Price Received increased 2.8% to 100.2%
  • Months Supply of Homes For Sale decreased 38.1% to 1.3

All comparisons are to 2019

Click here for the full Weekly Market Activity Report. From MAAR Market Data News.

Despite pandemic, this year is on-track for record-breaking sales

New listings flat, sales up, price growth strong, market times fast, but supply levels extremely low

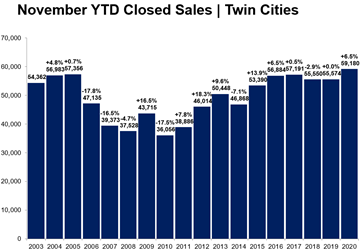
(December 17, 2020) – According to new data from the Minneapolis Area REALTORS® and the Saint Paul Area Association of REALTORS®, the growth in buyer and seller activity in the 16-county Twin Cities metro continues to climb above 2019 levels. Seller activity rose 1.3 percent from last November while new purchase agreements were up 13.4 percent over last year. That marks the strongest November pending sales figure since 2004 and the highest closed sales since at least 2003.


This year, the fall and winter markets are behaving more like a spring market since activity was delayed from the spring and summer months. While sellers only listed slightly more units than last November, pending and closed sales were up significantly. Pending sales often act as a leading indicator of future demand while closings lag.“The Twin Cities housing market continues to exceed expectations,” according to Patrick Ruble, President of the Saint Paul Area Association of REALTORS®. “Despite record sales figures, the lack of adequate supply—particularly affordable units—continues to frustrate buyers.”

Historically low mortgage rates, shifting work and learning patterns, health concerns and other factors are driving this sellers’ market. While all areas and price points are unique, sellers are getting strong offers early on. On average, sellers obtained 100.2 percent of their original list price—the highest November figure since at least 2003. At a median of 15 days, homes went under contract in record time, and 48.3 percent faster than last November.

“It’s truly impressive that sales would reach new highs during a pandemic and an otherwise challenging year,” said Linda Rogers, President of Minneapolis Area REALTORS®. “That’s of course meant rising home prices, but luckily, ultra-low interest rates have been able to partly offset that.”

Sales were up 21.5 percent in Minneapolis and 30.8 percent in St. Paul, suggesting buyers are eager to quickly snap up any new listings. And the competitive landscape means those buyers are often going above list price. With prices slightly lower, market times higher and offers weaker, the condo market continues to lag other segments. However, sales of luxury properties ($1M+) have been soaring higher—up nearly 20.0 percent YTD. One thing is clear: the housing market continues to outperform, despite the many economic headwinds.

November 2020 by the numbers compared to a year ago

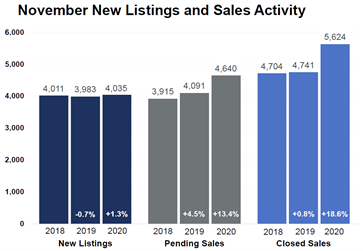
  • Sellers listed 4,035 properties on the market, a 1.3 percent increase from last November
  • Buyers signed 4,640 purchase agreements, up 13.4 percent (5,624 closed sales, up 18.6 percent)
  • Inventory levels fell 37.9 percent to 6,642 units
  • Months Supply of Inventory was down 42.9 percent to2 months (5-6 months is balanced)
  • The Median Sales Price rose 10.7 percent to $310,000
  • Days on Market decreased 33.3 percent to 34 days, on average (median of 15, down 48.3 percent)
  • Changes in Sales activity varied by market segment
    • Single family sales were up 21.3 percent; condo sales fell 2.6 percent; townhome sales increased 20.6 percent
    • Traditional sales rose 19.7 percent; foreclosure sales were down 22.9 percent; short sales fell 18.8 percent
    • Previously owned sales were up 21.7 percent; new construction sales climbed 4.8 percent

From The Skinny Blog.

Weekly Market Report

For Week Ending December 5, 2020

The National Association of REALTORS® released a new report analyzing relocation trends during the pandemic. From March through October 2020, 8.9 million people moved according to the NAR’s analysis of USPS change-of-address data. While this sounds substantial, when comparing to the same period last year, only approximately 94,000 more people moved this year than a year ago. The biggest trend was people moving from large cities to surrounding suburbs, with those counties located closest to big cities seeing the highest relocation gains.

In the Twin Cities region, for the week ending December 5:

  • New Listings decreased 2.9% to 851
  • Pending Sales increased 7.1% to 999
  • Inventory decreased 35.3% to 6,748

For the month of October:

  • Median Sales Price increased 12.5% to $315,000
  • Days on Market decreased 23.9% to 35
  • Percent of Original List Price Received increased 2.4% to 100.5%
  • Months Supply of Homes For Sale decreased 36.0% to 1.6

All comparisons are to 2019

Click here for the full Weekly Market Activity Report. From MAAR Market Data News.

Weekly Market Report


For Week Ending November 28, 2020

On Tuesday, the Dow Jones Industrial Average closed over 30,000 for the first time based on the good news in the development of coronavirus vaccines. Strength in the stock market, coupled with ongoing near-record low mortgage rates, continues to support healthy buyer demand in the market, though many take a short pause over the Thanksgiving holiday this week.

In the Twin Cities region, for the week ending November 28:

  • New Listings increased 11.2% to 568
  • Pending Sales increased 13.6% to 829
  • Inventory decreased 34.8% to 7,219

For the month of October:

  • Median Sales Price increased 12.5% to $315,000
  • Days on Market decreased 23.9% to 35
  • Percent of Original List Price Received increased 2.4% to 100.5%
  • Months Supply of Homes For Sale decreased 36.0% to 1.6

All comparisons are to 2019

Click here for the full Weekly Market Activity Report. From MAAR Market Data News.

Weekly Market Report


For Week Ending November 21, 2020

The National Association of REALTORS® reported that existing-home sales rose again in October, the fifth monthly increase in a row. Total existing-home sales increased 4.3% from September, rising to a seasonally adjusted annual rate of 6.85 million homes, and marking the highest home sales level in 15 years. While home sales activity slows during the holiday season, overall buyer demand remains strong.

In the Twin Cities region, for the week ending November 21:

  • New Listings increased 5.2% to 990
  • Pending Sales increased 8.8% to 1,093
  • Inventory decreased 33.5% to 7,604

For the month of October:

  • Median Sales Price increased 12.5% to $315,000
  • Days on Market decreased 23.9% to 35
  • Percent of Original List Price Received increased 2.4% to 100.5%
  • Months Supply of Homes For Sale decreased 36.0% to 1.6

All comparisons are to 2019

Click here for the full Weekly Market Activity Report. From MAAR Market Data News.