
“A trend of market balance is emerging as we approach the end of 2018.”
Monthly Archives: November 2018
Weekly Market Report

For Week Ending November 17, 2018
Sales and new listings continue to perform well in much of the nation thanks to a booming economy. Housing affordability remains a concern and is beginning to affect new single-family home construction. Builders are showing caution in the face of rising home prices and mortgage rates. Historically, housing can still be considered relatively affordable, but affordability measures have shown decline for several years. If this continues, it could negate recent gains in inventory.
In the Twin Cities region, for the week ending November 17:
- New Listings increased 6.7% to 955
- Pending Sales decreased 7.0% to 891
- Inventory increased 0.9% to 11,273
For the month of October:
- Median Sales Price increased 8.6% to $265,000
- Days on Market decreased 7.7% to 48
- Percent of Original List Price Received increased 0.2% to 97.9%
- Months Supply of Inventory remained flat at 2.4
All comparisons are to 2017
Click here for the full Weekly Market Activity Report. From The Skinny Blog.
Weekly Market Report
For Week Ending November 10, 2018
The Bureau of Labor Statistics recently reported that the unemployment rate for October 2018 remained unchanged from the prior month at 3.7 percent. Low unemployment has been one of many positive outcomes during a strong U.S. economy. Real estate has also been a benefactor of recent economic strength, as cranes dot U.S. skylines and median sales prices have increased in most residential real estate markets for several years. Gainful employment is important in order for these conditions to continue.
In the Twin Cities region, for the week ending November 10:
- New Listings increased 9.4% to 1,012
- Pending Sales decreased 6.1% to 949
- Inventory increased 0.8% to 11,649
For the month of October:
- Median Sales Price increased 8.6% to $265,000
- Days on Market decreased 7.7% to 48
- Percent of Original List Price Received increased 0.2% to 97.9%
- Months Supply of Inventory remained flat at 2.4
All comparisons are to 2017
Click here for the full Weekly Market Activity Report. From The Skinny Blog.
Supply tight but flattening, prices still rising, sales fluctuating
By David Arbit on Friday, November 16th, 2018
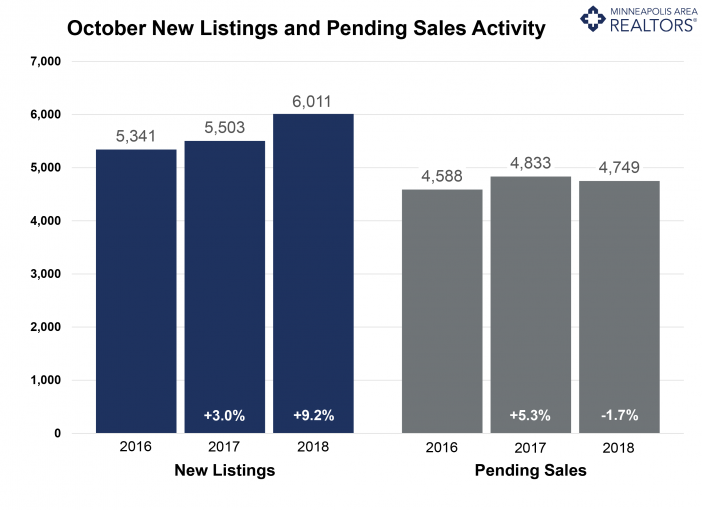
As sentiments regarding the direction of housing markets have changed, it’s worth remembering two key facts. First, all housing is local—what’s happening in San Francisco, Seattle and Denver is not reflective of the Minneapolis-St. Paul market. Second, the housing market faces fewer risks than in the mid-2000s. After years of strong buyer activity and weak seller activity, the tides seem to finally be shifting. Five of the last six months showed increases in new listings; while five of the last six months also had decreases in pending sales. It’s worth noting there’s a significant difference between deceleration and contraction. The market is decelerating, but not yet contracting. Prices continue to rise, homes are selling in less time and sellers are yielding a higher share of their list price.
Excluding September 2018, October had the smallest decline in active listings since May 2015, and those long-awaited inventory gains could arrive as early as next year. Months supply was stable at 2.4 months, suggesting a tight market but also a flattening out pattern. Rising rates could impact some budget-conscious buyers. The lack of supply is especially noticeable at the entry-level prices, where multiple offers and homes selling for over list price are commonplace. The move-up and upper-bracket segments are less competitive and—for the most part—much better supplied. Inventory could double while sales remain stable and we’d still have less than 5 months of supply.
OCTOBER 2018 BY THE NUMBERS (COMPARED TO A YEAR AGO)
– Sellers listed 6,011 properties on the market, a 9.2 percent increase
– Buyers closed on 5,235 homes, a 3.4 percent increase from last October
– Inventory levels for October fell 2.2 percent compared to 2017 to 11,719 units
– Months Supply of Inventory was flat at 2.4 months
– The Median Sales Price rose 8.6 percent to $265,000, a record high for September
– Cumulative Days on Market declined 7.7 percent to 48 days, on average (median of 28)
– Changes in Sales activity varied by market segment:
Single family sales rose 4.4 percent; condo sales jumped 10.6 percent; townhome sales were flat
Traditional sales rose 5.2 percent; foreclosure sales sank 41.2 percent; short sales rose 4.5 percent
Previously-owned sales were up 3.7 percent; new construction sales increased 12.3 percent
From The Skinny Blog.
Weekly Market Report
For Week Ending November 3, 2018
According to Freddie Mac, the 30-year fixed rate is at its highest average in seven years, reaching 4.94 percent. Last year at this time, the average rate was 3.90 percent. The higher rates are causing a slowdown in home price growth in some markets, but not all markets yet. Keeping a positive perspective, average rates were 5.97 percent ten years ago at this time, 6.78 percent 20 years ago and 10.39 percent 30 years ago. For maximum comparative impact, consider the 17.21 percent average rate of November 1981.
In the Twin Cities region, for the week ending November 3:
- New Listings increased 9.7% to 1,115
- Pending Sales decreased 16.5% to 943
- Inventory decreased 1.1% to 12,095
For the month of September:
- Median Sales Price increased 6.1% to $262,000
- Days on Market decreased 16.0% to 42
- Percent of Original List Price Received increased 0.3% to 98.4%
- Months Supply of Inventory remained flat at 2.6
All comparisons are to 2017
Click here for the full Weekly Market Activity Report. From The Skinny Blog.
Weekly Market Report
For Week Ending October 27, 2018
Real estate professionals from around the globe recently gathered in Boston to network, teach, learn and share at the National Association of REALTORS® Conference and Expo. It is an annual tradition that has been going strong since 1908. An organized real estate industry is a healthy one that can have a positive effect on real estate transactions and beyond. The relative market balance being experienced across the nation can’t entirely be attributed to REALTOR® cooperation, but it certainly doesn’t hurt.
In the Twin Cities region, for the week ending October 27:
- New Listings increased 15.0% to 1,239
- Pending Sales decreased 9.1% to 941
- Inventory decreased 1.4% to 12,374
For the month of September:
- Median Sales Price increased 6.1% to $262,000
- Days on Market decreased 16.0% to 42
- Percent of Original List Price Received increased 0.3% to 98.4%
- Months Supply of Inventory remained flat at 2.6
All comparisons are to 2017
Click here for the full Weekly Market Activity Report. From The Skinny Blog.