Weekly Market Report

For Week Ending March 18, 2017

The number of existing home sales was down last month, indicating that there is still a large divide between supply and demand. However, we need to keep in mind that the value of the housing market is the highest it has been in years. Confidence and household incomes are increasing, which are indicators of future home buying, which should lead to a continued strong market.

In the Twin Cities region, for the week ending March 18:

  • New Listings decreased 2.2% to 1,728
  • Pending Sales decreased 2.7% to 1,247
  • Inventory decreased 23.7% to 9,633

For the month of February:

  • Median Sales Price increased 7.8% to $223,500
  • Days on Market decreased 14.6% to 82
  • Percent of Original List Price Received increased 1.4% to 96.5%
  • Months Supply of Inventory decreased 28.0% to 1.8

All comparisons are to 2016

Click here for the full Weekly Market Activity Report. From The Skinny Blog.

Dear sellers, now is your time to shine!

By David Arbit on Monday, March 20th, 2017

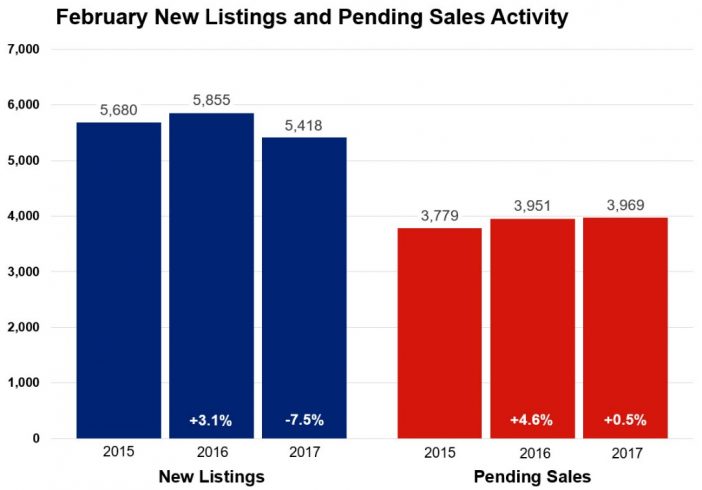
With the number of homes available for sale at a 14-year low, the well-priced homes that are on the market are often getting full-price offers or better in record time. Active listings continue to drop, they’re currently down 25.3 percent compared to last February. Those shopping for homes have 8,820 options from which to choose. But not enough sellers are taking advantage of the opportunity to have their listing truly stand out. New listings declined 7.5 percent to 5,418, while buyers signed just slightly more contracts this February compared to last. Pending sales increased 0.5 percent from February 2016. The fact that contract signing hasn’t slowed down despite the supply constraints is testimony to the determination of Twin Cities home buyers. Closed sales, on the other hand, fell 18 units shy of last year’s levels.MAAR-February-2017-Stats-News-Release-702x490

The median sales price increased 7.6 percent from last February to $223,000. Competing bids in the form of multiple offers on attractive properties in the most desirable neighborhoods are common in low inventory environments. Properties also tend to sell quickly and for close to or above list price. Average days on market until sale fell 14.6 percent to 82 days compared to 96 in February 2016. The average percent of original list price received at sale was 96.5 percent, 1.4 percent higher than last February. Given the strong demand and weak supply, our market has only 1.8 months of supply—the second lowest figure on record for any month since January 2003. This indicator measures the balance between supply and demand. Generally, five to six months of supply is considered a balanced market.

“So far 2017 is off to a healthy start, but we need more sellers in order to sustain this recovery,” said Cotty Lowry, Minneapolis Area Association of REALTORS® (MAAR) President. “Diminishing gains on the demand side could already reflect the dramatic supply shortages that today’s home buyers are experiencing. It’s critical to aim for balance—where neither buyers nor sellers have a clear advantage.”

A thriving local economy has been conducive to housing recovery. The most recent national unemployment rate is 4.7 percent, though it’s 3.6 percent locally. The Minneapolis–St. Paul metropolitan area has one of the lowest unemployment rates of any major metro area. Private job growth has also exceeded expectations lately.

The average 30-year fixed mortgage rate stands at 4.17 percent, still well below a long-term average of roughly 8.0 percent. Many observers are expecting the Federal Reserve to increase their target federal funds rate at the March meeting. Barring any unforeseen events or economic data surprises, the Fed is likely to make at least one more rate adjustment in 2017. Job, wage and inventory growth are key to offsetting affordability declines brought on by higher rates.

“The momentum in the market continues to favor sellers and higher prices—though not in every area nor at every price point,” said Kath Hammerseng, MAAR President-Elect. “As we move into the spring market, more buyers will compete for limited inventory, making this environment quite attractive for sellers.”
From The Skinny Blog.

Weekly Market Report

For Week Ending March 11, 2017

In the last three months, the Federal Reserve has now twice increased its benchmark interest rate a quarter point. The good news is that this was an expected move due to strong confidence in the economy. Mortgage rates will likely increase as well. That said, homes are still selling quickly, and there is little indication that the trend will slow down in the spring and summer months.

In the Twin Cities region, for the week ending March 11:

  • New Listings decreased 3.3% to 1,740
  • Pending Sales decreased 11.1% to 1,102
  • Inventory decreased 24.8% to 9,290

For the month of February:

  • Median Sales Price increased 7.7% to $223,250
  • Days on Market decreased 14.6% to 82
  • Percent of Original List Price Received increased 1.4% to 96.5%
  • Months Supply of Inventory decreased 28.0% to 1.8

All comparisons are to 2016

Click here for the full Weekly Market Activity Report. From The Skinny Blog.

Weekly Market Report

For Week Ending March 4, 2017

Tight inventory, lower affordability and higher mortgage rates continue to dominate residential real estate news, but a declining unemployment rate offers a bright spot. Employment in the construction industry had some of the largest gains. It would be great to see this increase translate into an impact on the construction of new homes for sale.

In the Twin Cities region, for the week ending March 4:

  • New Listings decreased 11.9% to 1,727
  • Pending Sales increased 0.3% to 1,155
  • Inventory decreased 23.4% to 9,042

For the month of February:

  • Median Sales Price increased 7.6% to $223,000
  • Days on Market decreased 14.6% to 82
  • Percent of Original List Price Received increased 1.4% to 96.5%
  • Months Supply of Inventory decreased 28.0% to 1.8

All comparisons are to 2016

Click here for the full Weekly Market Activity Report. From The Skinny Blog.

Weekly Market Report

For Week Ending February 25, 2017

As mortgage rates rise, median sales prices increase and stiff competition for low inventory continues, buyers are beginning to face some limitations with their housing options, especially for first-time buyers. That being said, for most weeks in 2017, sales have been higher in year-over-year comparisons with the same weeks in 2016.

In the Twin Cities region, for the week ending February 25:

  • New Listings decreased 7.6% to 1,345
  • Pending Sales decreased 6.7% to 980
  • Inventory decreased 23.7% to 8,950

For the month of January:

  • Median Sales Price increased 4.6% to $224,900
  • Days on Market decreased 7.1% to 79
  • Percent of Original List Price Received increased 0.9% to 95.9%
  • Months Supply of Inventory decreased 26.1% to 1.7

All comparisons are to 2016

Click here for the full Weekly Market Activity Report. From The Skinny Blog.

The Great Mean Reversion

By David Arbit on Tuesday, February 28th, 2017
4-pct-annual-growth-702x479© MAAR 2017 | All rights reserved.

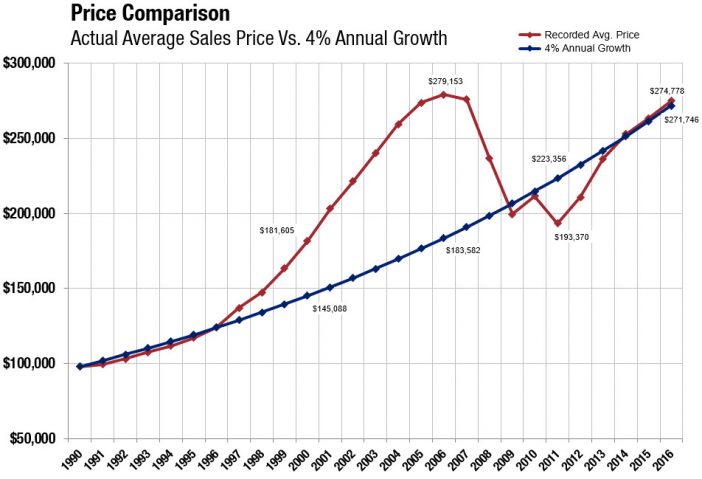
We have all heard the saying “everything eventually reverts to the mean.” No? Fair enough. There’s a saying that goes “everything eventually reverts to the mean.” It’s a way of expressing that, over a sufficient time period, a data set can only remain above or below its long-term trend for so long, but eventually should come back in line with historical averages or growth rates. Applied to our industry, home prices could only stay above trend for so long. Alas, the gravitational pull of market forces is a powerful and unrelenting wonder (with mostly measurable and rational underpinnings).

Take, for example, the graphic above which plots reported average home prices alongside 4.0 percent steady annual growth per year. Both trendlines start at the same point–the reported averages sales price in 1990. After the early 1990s ran slightly below trend, 1997-2008 way above trend, 2009-2013 well below trend and 2014-2016 slightly above trend, we are right back in line with where the 4.0 percent growth trend is. This is why some economists use a pendulum analogy when discussing market forces. Markets tend to over-swing “balance” or “equilibrium.” With so much momentum, they tend to move from one extreme to another, without stopping in the middle. We tend to lurch from buyer’s markets to seller’s markets to buyer’s markets and now back to a seller’s market.

Huh. Funny how that works. All the fuss, all the lost equity, all the subsequent appreciation, all those foreclosures, all the boom-bust cycles, all those debates about over or under-regulated wall street banks and mortgage markets and whether housing can go higher still and if incomes can keep up. And for what?

Home prices ended up more or less where they belong. We’ve reverted right back to our historical growth trend. The market is back where it should be had housing appreciated at a steady 4.0 percent per year.

It’s not just housing, commodity and capital markets that gravitate back to their long-term trajectories. Sea turtles, sockeye salmon and other members of the animal kingdom also understand the instinctual pull of home. No matter how far they roam, they travel vast distances to return to their original habitat–the environment that gives them a sense of familiarity and balance.

From The Skinny Blog.