Weekly Market Report

For Week Ending January 20, 2018

Existing-home sales, which are completed transactions that include single-family homes, townhomes, condominiums and co-ops, were up 1.1 percent in 2017 compared to 2016 to 5.5 million sales, becoming the best year for sales in 11 years. Overall, the housing market performed well in 2017 within a strong economy. Homeowners made healthy price gains at sale, and distressed property sales have returned to historically low marks.

In the Twin Cities region, for the week ending January 20:

  • New Listings decreased 9.8% to 943
  • Pending Sales decreased 5.7% to 726
  • Inventory decreased 25.4% to 7,062

For the month of December:

  • Median Sales Price increased 9.7% to $248,000
  • Days on Market decreased 15.3% to 61
  • Percent of Original List Price Received increased 1.3% to 97.1%
  • Months Supply of Inventory decreased 26.3% to 1.4

All comparisons are to 2017

Click here for the full Weekly Market Activity Report. From The Skinny Blog.

Home Prices Reach Record High; Home Sales Reach 12-year High

By David Arbit on Wednesday, January 24th, 2018

2017 Annual Wrap-Up:
The big story of 2017 was threefold: the median sales price reached an all-time high; closed sales reached a 12-year high; and inventory levels reached a 15-year low. Sales nearly broke their all-time record, but fell just 12 units short of their all-time 2004 high. Seller activity declined slightly for a second year. Near-record sales activity combined with weaker seller activity exacerbated the supply shortage. For-sale housing supply fell to a 15-year low. This shortage has created a competitive environment where multiple offers have become more common. Sellers are receiving strong offers in record time, but this fast-paced market can frustrate some consumers. Days on market fell to an 11-year low. Absorption rates fell to 1.4 months of supply at year-end, also a 15-year record low. Foreclosure activity fell for a sixth straight year and is back below 2007 levels. Although single-family homes made up about 75.0 percent of all sales, both townhomes and condos showed a stronger increase in sales. Similarly, previously-owned homes made up about 93.0 percent of sales but new construction showed a much stronger increase.

2017 by the Numbers
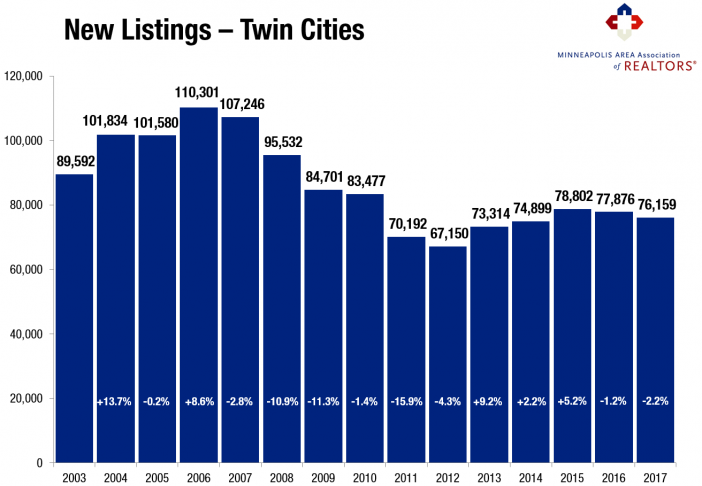
• Sellers listed 76,159 properties on the market, a 2.2 percent decrease from 2016
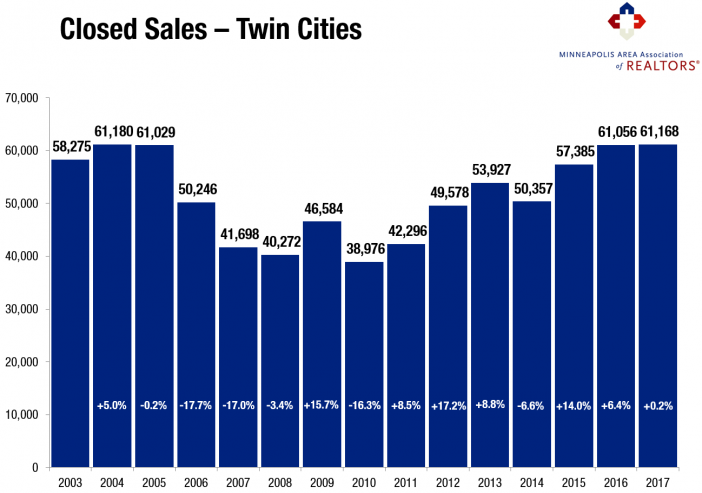
• Buyers closed on 61,168 homes, a 0.2 percent increase from 2016 and the highest figure since 2004
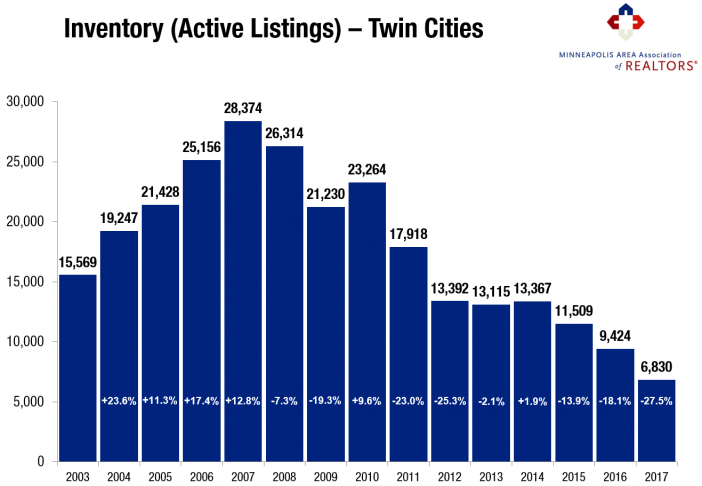
• Inventory levels for December fell 27.5 percent compared to 2016 to 6,830 units, a 15-year low
• Months Supply of Inventory was down 26.3 percent to 1.4 months, also a 15-year low
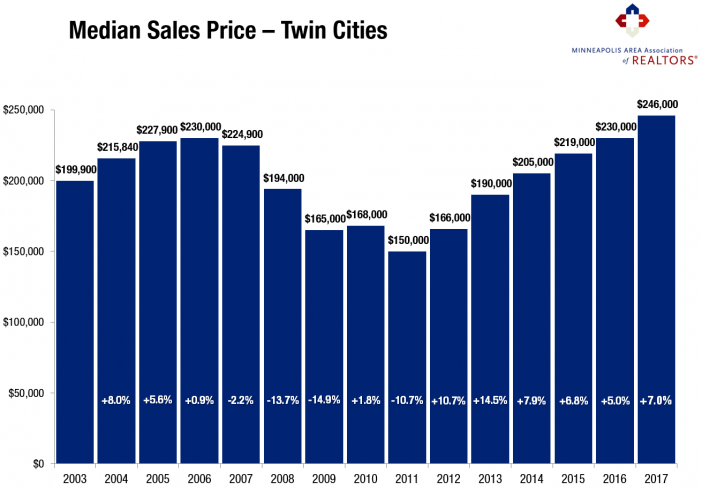
• The Median Sales Price rose 7.0 percent to $246,000, which is an all-time record high
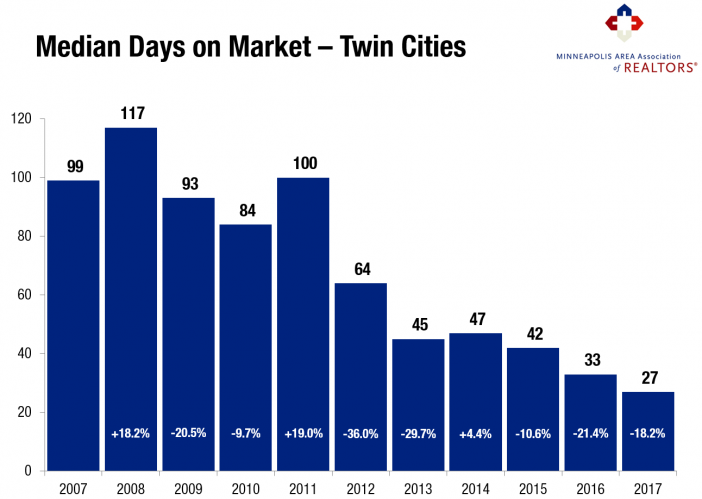
• Cumulative Days on Market declined 13.8 percent to 56 days, on average (median of 27)—an 11-year record low
• Changes in sales activity varied dramatically by market segment:

Single-family sales decreased 1.1 percent; condo sales rose 2.0 percent; townhome sales rose 5.7 percent
Traditional sales rose 3.7 percent; foreclosure sales fell 42.8 percent; short sales fell 49.9 percent
Previously-owned sales declined 0.7 percent; new construction sales rose 13.9 percent

“It was an interesting year in a lot of ways. In addition to record prices and near-record sales, the inventory shortage and some affordability concerns also took center stage. Our region is extremely high-performing when it comes to homeownership, employment, education and quality of life. That said, as some market challenges get resolved, expect homeownership to remain an attractive opportunity moving forward,” said Kath Hammerseng, president of the Minneapolis Area Association of REALTORS®.

Sellers posted their second consecutive decrease in activity. New listings were down a slight 2.2% compared to 2016. Many sellers are still motivated by rising prices and quick market times, some sellers have decided to wait it out, enjoy the ride up and hope for more inventory choices before they list their home for sale.

Buyers were active in 2017. Closed sales reached a 13-year high and were within 12 sales of breaking their all-time record from 2004. Encouraged by low interest rates, rising rents and an improving economy, housing demand was exceptionally strong. These gains were driven by more activity in the higher price brackets, as well as increases in condo-townhomes and new construction.

With supply levels at 15-year lows and demand indicators at 12-year highs, the median sales price rose 7.0 percent to $246,000. This marks an all-time record high. Home prices have risen 64.0% from their low point in 2011. Rising prices boost equity, motivate reluctant sellers and replenish local tax base, but can also harm affordability if incomes don’t keep pace.

Inventory levels fell 27.5% to a 15-year low. Consumers had 6,830 options to choose from in December but over 13,400 in July. When combined with strong demand, this supply-side constraint has resulted in competitive bidding on some listings. This shortage has frustrated some buyers. Replenishing supply levels is critical to sustained market health as well as to maintaining a spectrum of housing opportunity for all buyers.

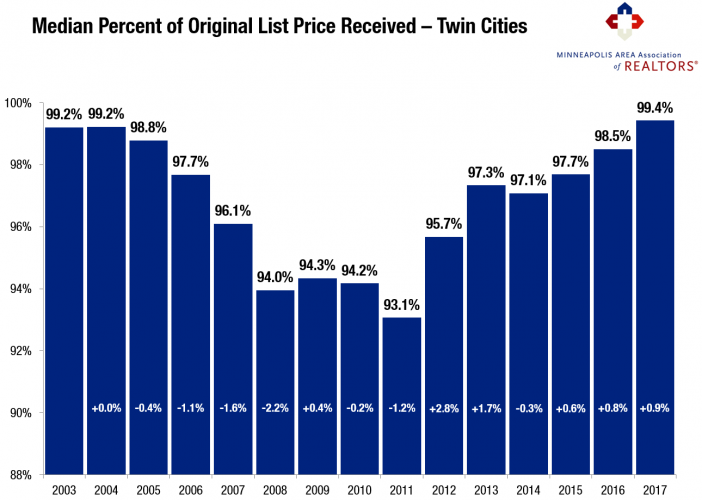
Mostly due to fundamentals but also better pricing decisions, sellers yielded a higher share of their asking price. The median percent of original list price received reached a record high of 99.4 percent. Sellers had a 50/50 chance of receiving more than their current list price. The landscape for sellers has improved immensely. Most sellers can expect to receive offers very close to their list price.

Homes are selling at an 11-year record pace. Listings spent a median of 27 days on the market, 18.3 percent fewer than in 2016. That is less than half the market time from 2012 and nearly a quarter of the market time from 2011. Among other trends, the fact that homes are selling in less time at higher price points should reinforce seller confidence. That’s motivating to sellers, and our market is thirsty for additional inventory.

From The Skinny Blog.

Weekly Market Report

For Week Ending January 13, 2018

At the beginning of a calendar year, it is often common for home buyers and sellers to become immediately more active. Call it the result of a resolution or the promise of something new, but it is a noted phenomenon across the country. It’s really too early to say if the trend will continue in 2018, but the first weeks of the year have not necessarily shown a huge jolt in activity so much as the last weeks of 2017 were quieter than usual.

In the Twin Cities region, for the week ending January 13:

  • New Listings decreased 5.4% to 892
  • Pending Sales decreased 13.0% to 577
  • Inventory decreased 26.9% to 6,918

For the month of December:

  • Median Sales Price increased 9.7% to $248,000
  • Days on Market decreased 15.3% to 61
  • Percent of Original List Price Received increased 1.3% to 97.1%
  • Months Supply of Inventory decreased 26.3% to 1.4

All comparisons are to 2017

Click here for the full Weekly Market Activity Report. From The Skinny Blog.

Weekly Market Report

For Week Ending January 6, 2018

As we embark upon the 2018 campaign, watch for upward movement in some of the same areas for wanted improvements in 2017. The number of homes available for sale continues to be a key factor in the dynamics of residential real estate. Simply put, it would be good to have more inventory available for purchase. Buying a home is a viable and exciting option for many consumers, and having more homes to choose from is one way to assure that the dream of homeownership is an affordable achievement.

In the Twin Cities region, for the week ending January 6:

  • New Listings decreased 13.4% to 850
  • Pending Sales decreased 10.7% to 534
  • Inventory decreased 26.7% to 6,904

For the month of December:

  • Median Sales Price increased 9.8% to $248,200
  • Days on Market decreased 15.3% to 61
  • Percent of Original List Price Received increased 1.3% to 97.1%
  • Months Supply of Inventory decreased 26.3% to 1.4

All comparisons are to 2017

Click here for the full Weekly Market Activity Report. From The Skinny Blog.

Weekly Market Report

For Week Ending December 30, 2017

As we close the books on 2017, it is clear that there is an ongoing national housing shortage. Year-over-year inventory levels have been down in most markets for several years now, and that trend is expected to persist in 2018. Even if there are occasional increases in the number of homes for sale from week to week, home supply is too low to achieve a balanced market. That said, consumers are most definitely purchasing homes quickly and often above asking price. Demand is strong, and there is plenty to feel optimistic about in 2018.

In the Twin Cities region, for the week ending December 30:

  • New Listings decreased 37.7% to 243
  • Pending Sales decreased 8.7% to 451
  • Inventory decreased 24.6% to 7,712

For the month of November:

  • Median Sales Price increased 6.5% to $245,000
  • Days on Market decreased 11.1% to 56
  • Percent of Original List Price Received increased 0.8% to 97.4%
  • Months Supply of Inventory decreased 21.7% to 1.8

All comparisons are to 2016

Click here for the full Weekly Market Activity Report. From The Skinny Blog.

Weekly Market Report

For Week Ending December 23, 2017

As is usually the case this time of year, housing activity will slow down for a few weeks during the last of the 2017 holidays. Shrewd buyers and sellers will take advantage of this slower time of year to make meaningful deals, especially ahead of perceived or real changes that are due to take place in 2018 as regards taxes, mortgage rates, housing affordability and other factors.

In the Twin Cities region, for the week ending December 23:

  • New Listings increased 14.4% to 422
  • Pending Sales increased 8.0% to 702
  • Inventory decreased 23.8% to 8,120

For the month of November:

  • Median Sales Price increased 6.5% to $245,000
  • Days on Market decreased 11.1% to 56
  • Percent of Original List Price Received increased 0.8% to 97.4%
  • Months Supply of Inventory decreased 21.7% to 1.8

All comparisons are to 2016

Click here for the full Weekly Market Activity Report. From The Skinny Blog.