Weekly Market Report

Higher prices gave sellers reason for optimism in early 2014. As prices stabilize, some are sensing the formation of a counter-trend. Silly rabbits. Price alone does not determine the state of the housing market. Number of sales by housing segment, the types of households being formed and the availability of well-paying jobs all play important roles to housing health. As the summer months approach, things like inventory of homes for sale, new listings and number of days on market until sale, along with pricing, will help predict the direction of the housing market.

In the Twin Cities region, for the week ending May 17:

  • New Listings increased 10.0% to 2,039
  • Pending Sales decreased 8.3% to 1,175
  • Inventory increased 4.1% to 15,432

For the month of April:

  • Median Sales Price increased 7.5% to $196,129
  • Days on Market decreased 8.2% to 89
  • Percent of Original List Price Received decreased 0.1% to 95.9%
  • Months Supply of Inventory increased 2.9% to 3.5

All comparisons are to 2013

Click here for the full Weekly Market Activity Report. From The Skinny.

Weekly Market Report

April showers bring the Speedwell. This could have been the mantra if 1620 had gone differently (go ahead and Google it). Either way, the May flowers are rising high even as mortgage rates stay persistently low, which helps boost affordability regardless of rising prices. More mortgage applications means more first-time buyers dipping into homeownership. Lower unemployment levels will also help direct buyers toward the rosy scent of a new home.

In the Twin Cities region, for the week ending May 10:

  • New Listings increased 6.5% to 1,979
  • Pending Sales increased 0.1% to 1,264
  • Inventory increased 3.5% to 15,009

For the month of April:

  • Median Sales Price increased 7.6% to $196,425
  • Days on Market decreased 8.2% to 89
  • Percent of Original List Price Received decreased 0.1% to 95.9%
  • Months Supply of Inventory remained flat at 3.4

All comparisons are to 2013

Click here for the full Weekly Market Activity Report. From The Skinny.

Weekly Market Report

Market normalization and an improved product mix is presented as housing weakness by some. However, price increases, demand and an improving national economic scene paint a brighter housing landscape. According to the Mortgage Bankers Association, total week-over-week mortgage application volume rose 5.3 percent on a seasonally adjusted basis. The trends for the drivers of new housing starts are as important as the trends within residential real estate. Where you find money and jobs, you find a fruitful housing market.

In the Twin Cities region, for the week ending May 3:

  • New Listings increased 1.4% to 1,856
  • Pending Sales decreased 13.4% to 1,203
  • Inventory increased 2.6% to 14,688

For the month of April:

  • Median Sales Price increased 7.6% to $196,425
  • Days on Market decreased 8.2% to 89
  • Percent of Original List Price Received decreased 0.2% to 95.8%
  • Months Supply of Inventory remained flat at 3.4

All comparisons are to 2013

Click here for the full Weekly Market Activity Report. From The Skinny.

Traditional Sales Dominating the Housing Market

Home sales in the 13-county Minneapolis–St. Paul metropolitan area have appeared lackluster of late on the surface, but if you turn the dirt, you’ll see more intriguing colors in the flowering market mix. Overall closed sales were down 11.9 percent to 3,806 for April 2014, but traditional sales were actually up 1.4 percent. The total was brought down by a 41.8% decline in foreclosure sales and 40.8% decrease in short sales.

Increased seller activity is critical to replenishing inventories. New listings rose 10.2 percent to 7,776 newly listed homes, a welcome sign for prospective buyers. Inventory levels are still constrained, but consumers should have more options to choose from this year than last year.

With higher prices and more buyers on the prowl, more sellers are able to go the traditional route. Traditional new listings rose 25.7 percent compared to last year at this time, while foreclosure and short sale new listings fell 41.6 percent and 49.6 percent, respectively.

On the demand side, pending sales declined 3.9 percent to 5,127 properties overall, once again reflecting less distressed market activity. Traditional pending sales were up 8.2 percent while pending foreclosure and short sales fell 40.4 and 35.1 percent, respectively. The inventory of homes for sale in the Twin Cities is now at 14,429 properties, 1.5 percent more than last year at this time, marking the first year-over-year increase since October 2013 and the largest increase since January 2011.

6a00e54ee9620b883401a511b6a111970c-800wi

“We’re seeing the return of a real estate market led by traditional listings and sales,” said Emily Green, President of the Minneapolis Area Association of REALTORS® (MAAR). “Coupled with more inventory – attractive inventory – it’s setting up to be an exciting year for buyers and sellers.”

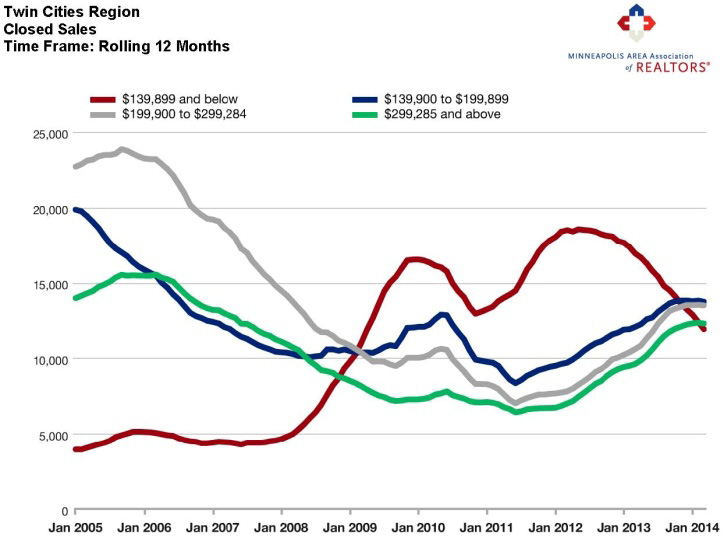
As a result of the ongoing shift in the types of homes being sold, the median sales price for the metro rose 8.0 percent to $197,000. That’s 26 straight months of year-over-year price gains. Foreclosures and short sales now make up just 11.4 percent of all new listings. Last April, they made up 22.4 percent. For closed sales, the number fell from 31.3 to 20.9 percent.

On average, homes spent 89 days on the market, down 8.2 percent from last April. Sellers are receiving an average of 95.9 percent of their original list price. The Twin Cities now has 3.4 months’ supply of inventory, the same mark that it was last April.

“Distressed inventory has made up the majority of the lower price ranges, and that market is evaporating,” said Mike Hoffman, MAAR President-Elect. “We can anticipate more negotiations and transactions with people rather than banks.”

All information is according to the Minneapolis Area Association of REALTORS® (MAAR) based on data from NorthstarMLS. MAAR is the leading regional advocate and provider of information services and research on the real estate industry for brokers, real estate professionals and the public. MAAR serves the Twin Cities 13-county metro area and western Wisconsin. 10K Research and Marketing, LLC is a wholly owned subsidiary of MAAR.

Weekly Market Report

There have already been a few items to watch in the burgeoning spring market, particularly around price, sales and inventory. Median sales prices are on the rise while sales have been a wee bit stubborn emerging from winter hibernation. Meanwhile, more choices are still needed for eager buyers. There’s still plenty of time for the market to catch fire, and there’s no reason to believe that it won’t.

In the Twin Cities region, for the week ending April 26:

  • New Listings increased 25.6% to 1,906
  • Pending Sales decreased 2.4% to 1,212
  • Inventory increased 0.5% to 14,318

For the month of March:

  • Median Sales Price increased 7.6% to $189,950
  • Days on Market decreased 12.0% to 95
  • Percent of Original List Price Received remained flat at 95.0
  • Months Supply of Inventory decreased 3.0% to 3.2

All comparisons are to 2013

Click here for the full Weekly Market Activity Report. From The Skinny.

April Monthly Skinny Video

Where has the Twin Cities real estate market been and where is it heading? This monthly summary provides an overview of current trends and projections for future activity. Narrated by Emily Green (2014 President, Minneapolis Area Association of REALTORS®), video produced by Chelsie Lopez.