Weekly Market Report

For Week Ending June 18, 2016

Like summer temperatures, home prices continue to inch up in most housing categories and geographic submarkets. Meanwhile, hopeful buyers are wishing for more options to fulfill the perfect fit. As we reach deeper into summer, dips in home sales are not unexpected. Even while people search for homes in which to move or start a family, summer is also about family time in other ways.

In the Twin Cities region, for the week ending June 18:

  • New Listings decreased 4.2% to 1,967
  • Pending Sales increased 1.9% to 1,389
  • Inventory decreased 19.0% to 14,085

For the month of May:

  • Median Sales Price increased 5.8% to $236,900
  • Days on Market decreased 21.1% to 60
  • Percent of Original List Price Received increased 1.1% to 98.6%
  • Months Supply of Inventory decreased 26.3% to 2.8

All comparisons are to 2015

Click here for the full Weekly Market Activity Report. From The Skinny Blog.

Weekly Market Report

For Week Ending June 11, 2016

The pace of new homes being built is slower than necessary to keep inventory figures up, especially in a time with plenty of demand. However, building permits are active and low mortgage rates continue to provide opportunity for the residential real estate market to continue to be a pillar of the national economic profile.

In the Twin Cities region, for the week ending June 11:

  • New Listings decreased 0.3 percent to 2,056
  • Pending Sales decreased 7.1% to 1,370
  • Inventory decreased 19.2% to 13,869

For the month of May:

  • Median Sales Price increased 5.8% to $236,900
  • Days on Market decreased 21.1% to 60
  • Percent of Original List Price Received increased 1.1% to 98.6%
  • Months Supply of Inventory decreased 26.3% to 2.8

All comparisons are to 2015

Click here for the full Weekly Market Activity Report. From The Skinny Blog.

Sellers Uninspired by Record May Sales Activity

By Aubray Erhardt on Tuesday, June 14th, 2016

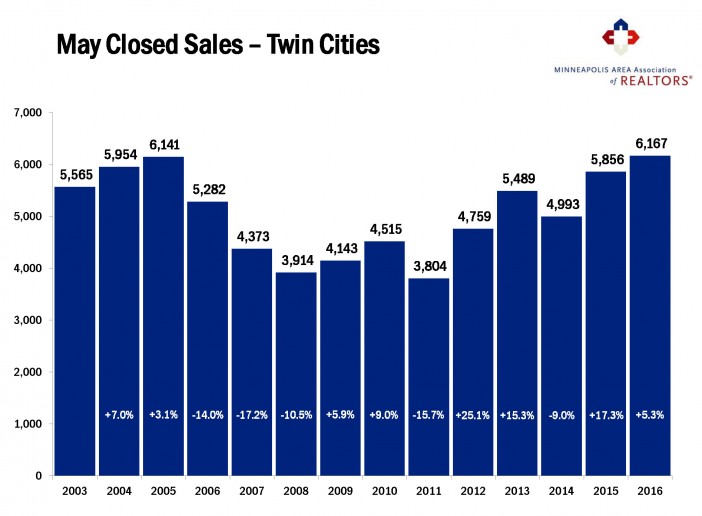
Pending home purchase activity exceeded year-ago levels for the 18th consecutive month. Buyers signed 6,809 new purchase agreements, a 9.9 percent gain compared to May 2015. Closed sales, however, rose 5.3 percent to 6,167—the highest May closed sales figure on record. In large part due to low inventory, would-be sellers are concerned about their ability to secure their next property in the current competitive environment. Inventory levels fell 20.6 percent to 13,372 active properties. Because of record demand, weak supply and a more expensive mix of homes selling, the May median sales price rose 5.7 percent to $236,826—second only to June 2006 for the highest monthly median sales price on record.

2016-05_image-702x516

Since the median percent of current list price received at sale was 100.0 percent, sellers effectively had the same chance of getting offers above their current list price as they did below. Those odds were exactly fifty-fifty—as they were in May 2005. That’s not the case for original list price, however. Cumulative days on market fell 21.1 percent to 60 days. That’s the fastest market time for any month since the beginning of 2007. Months supply of inventory fell 28.9 percent to 2.7 months—the lowest May figure on record going back to the beginning of 2003. Generally, five to six months of supply is considered a balanced market. While the metro as a whole is favoring sellers, not all areas, segments or price points necessarily reflect that. Market conditions are encouraging some sellers but not enough to fuel the demand seen in recent months.

“By a margin of just 26 units, last month’s closed sales reached a new record for May,” said Judy Shields, Minneapolis Area Association of REALTORS® (MAAR) President. “Despite record demand, not every home sells the day it hits the market in multiple offers. Some areas are more susceptible than others. Sellers hoping for short market times should know price strategy is still one of the most important factors in marketing your home.”

Smarter lending practices, job and wage increases, population growth, the ongoing threat of higher interest rates and relentlessly rising rents have all contributed to strong sales activity. A competitive Twin Cities labor market has also contributed to our housing recovery. Traditional (non-lender-mediated) listings made up 93.3 percent of all closed sales—the highest level in almost 10 years.

The most recent national unemployment rate is 4.7 percent, though it’s 3.4 percent locally. The Minneapolis-St. Paul-Bloomington metropolitan area has the fourth lowest unemployment rate of any major metro area. The 30-year fixed mortgage rate continued to hover around 3.6 percent compared to a long-term average of approximately 8.0 percent. Rates took a surprising dive after the Federal Reserve announced the first hike last year. Marginally higher interest rates were widely expected in 2016, though futures contracts currently peg the odds of a June rate hike at 4.0 percent and a July rate hike at 36.0 percent.

“Interest rates and job growth are fueling the demand in our market,” said Cotty Lowry, MAAR President-Elect. “But we have a serious inventory shortage that we know is holding back buyers, meaning there is still pent-up demand that may not have existed in a more balanced market.”
From The Skinny Blog.

Weekly Market Report

For Week Ending June 4, 2016

Summer is heating up, as are home sales and prices. Millennials are hitting home- buying age with force and are showing interest in entering the real estate market. As inventory continues to struggle to keep up with demand, options are fewer than desired, and price wars are proving to be a challenge for many buyers in a seller’s market.

In the Twin Cities region, for the week ending June 4:

  • New Listings decreased 7.9% to 2,011
  • Pending Sales decreased 15.3% to 1,203
  • Inventory decreased 19.5% to 13,571

For the month of May:

  • Median Sales Price increased 5.7% to $236,826
  • Days on Market decreased 21.1% to 60
  • Percent of Original List Price Received increased 1.1% to 98.6%
  • Months Supply of Inventory decreased 28.9% to 2.7

All comparisons are to 2015

Click here for the full Weekly Market Activity Report. From The Skinny Blog.

Weekly Market Report

For Week Ending May 28, 2016

The trends of higher sales and fewer homes for sale that prevailed through the first quarter of 2016 have only gotten stronger through the second quarter. Although more sellers are listing than at this time last year, it’s still not quite enough to keep up with the heat of today’s sales environment. Buyers appear to be making great offers ahead of any hint of higher mortgage rates.

In the Twin Cities region, for the week ending May 28:

  • New Listings increased 2.5% to 1,734
  • Pending Sales increased 18.6% to 1,597
  • Inventory decreased 18.8% to 13,669

For the month of April:

  • Median Sales Price increased 7.6% to $231,341
  • Days on Market decreased 14.1% to 73
  • Percent of Original List Price Received increased 1.0% to 98.0%
  • Months Supply of Inventory decreased 25.0% to 2.7

All comparisons are to 2015

Click here for the full Weekly Market Activity Report. From The Skinny Blog.