Weekly Market Report

The week left yet another trail of evidence leading back to a housing market on the mend. This time, the encouraging signs were even less clandestine. Nationally, both new and existing home sales enjoyed improvements. Even some December numbers were upwardly revised. New home sales have real and noticeable impacts on GDP, thus generating jobs and driving down unemployment. The overall bias for the entire U.S. is firmly toward balance. Locally, market activity was mostly positive. Spring will still be the major tell.

In the Twin Cities region, for the week ending February 18:

  • New Listings decreased 7.1% to 1,256
  • Pending Sales increased 28.6% to 899
  • Inventory decreased 23.2% to 17,756

For the month of January:

  • Median Sales Price decreased 3.4% to $140,000
  • Days on Market decreased 8.5% to 142
  • Percent of Original List Price Received increased 3.4% to 91.2%
  • Months Supply of Inventory decreased 34.6% to 4.7

Click here for the full Weekly Market Activity Report.

From The Skinny.

Weekly Market Report

The National Association of Homebuilders index recently rose to levels not seen since 2007. Historically, it’s been a great leading indicator of housing starts. We lead with this information because it is just the latest in a series of testimonials toward a market with some wind in its sails. In as few as four months, the residential real estate scene could look quite different than it has in recent years. That’s not to say that we’re wave riding our way to a national housing boom, but market fundamentals could be steering the rudder in the direction of calmer waters. For sellers eager to get out but unwilling to take capital losses, that’s more relieving than the usual threat of hull breach.

In the Twin Cities region, for the week ending February 11:

  • New Listings decreased 0.4% to 1,313
  • Pending Sales increased 28.9% to 928
  • Inventory decreased 23.5% to 17,690

For the month of January:

  • Median Sales Price decreased 3.4% to $140,000
  • Days on Market decreased 8.5% to 142
  • Percent of Original List Price Received increased 3.4% to 91.2%
  • Months Supply of Inventory decreased 34.6% to 4.7

Click here for the full Weekly Market Activity Report.

From The Skinny.

Weekly Market Report

It was a week full of intrigue if ever there was one. A positive jobs report gave way to bullish activity on Wall Street backed by heroics from the hometown team, as the Giants showcased their Manning(ham) magic. Meanwhile, dozens of state attorneys general brokered a deal that will likely include principal write-downs. In local housing news, buyers made more purchases while sellers listed fewer properties than during the same week in 2011. Other indicators have recently showcased key improvements elsewhere in the marketplace. The most notable trend is fewer active listings. Buyers in wait-and-see mode may find themselves with more competition for fewer properties come spring.

In the Twin Cities region, for the week ending February 4:

  • New Listings decreased 6.7% to 1,236
  • Pending Sales increased 35.8% to 888
  • Inventory decreased 23.2% to 17,697

For the month of January:

  • Median Sales Price decreased 3.4% to $140,000
  • Days on Market decreased 8.4% to 142
  • Percent of Original List Price Received increased 3.4% to 91.2%
  • Months Supply of Inventory decreased 35.2% to 4.6

Click here for the full Weekly Market Activity Report.

From The Skinny.

Pending Home Sales Highest Since 2005!

There were 3,149 purchase agreements signed in the 13-county Twin Cities metropolitan area during January, a 25.5 percent increase over last January. No doubt driven by a mix of record-low mortgage rates, affordable prices, strong negotiating leverage and unseasonably warm weather, that’s the highest January pending sales figure since 2005.

Sellers were less active, as new listings fell 9.0 percent from January 2011 to 5,112 properties. The number of homes for sale continued to drop, as well, down 28.1 percent from last year to 16,463 active listings – the lowest inventory reading for any month since 2003. Another important housing metric, months supply of inventory, remained at a six-year low of 4.6 months.

“If you look deeper into the strong sales figures, you can see which segments are leading the charge,” said Cari Linn, President of the Minneapolis Area Association of REALTORS®. “With inventory down, especially among foreclosures, and good purchase demand, buyers are finally looking harder at traditional properties.”

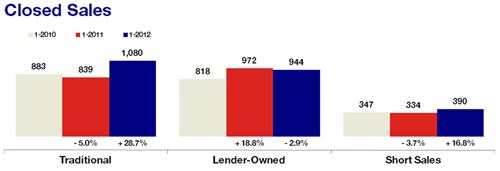
Traditional sales surged 28.7 percent, while foreclosure sales fell 2.9 percent and short sales increased 16.8 percent. For sellers, the landscape is shifting. For six consecutive months, sellers received progressively more of their asking price than they did the year prior. In January, sellers received an average of 91.2 percent of their original list price.

Sellers are also watching market times closely. The average number of days a listing spends on the market before closing was down 8.3 percent to 142 days—the fourth consecutive year-over-year decrease. But those looking to sell their properties should be aware of distressed market activity.
In January, 43.2 percent of all new listings were either foreclosure or short sales. Together these lender-mediated properties made up 55.3 percent of all closings. Homes in financial distress are exiting the marketplace faster than they are entering it, but they have still managed to prevent market-wide price appreciation. The median sales price was down a modest 3.4 percent from January 2011 to $140,000, marking the smallest decline since November 2010.

“Price declines are subsiding, partly thanks to changes on the supply-side of the equation. Rising home prices will still be the final phase of recovery,” said Andy Fazendin, MAAR President-Elect. “We firmly believe that what we’re seeing now is setting the stage for better times ahead.”

Weekly Market Report

Whether motivated by the election cycle, a jump in employment, improving housing market metrics or the best start to a year for the S&P 500 since 1989, home buyers posted increased activity levels compared to last year. Consumers signed more purchase agreements but sellers entered into fewer listing contracts. Changes in supply-side metrics confirm this, suggesting that relatively less new product is entering the market compared to buyer demand. That’s helped other metrics return to more friendly territory. Whatever the reason, it’s good to see that vote of confidence.

In the Twin Cities region, for the week ending January 28:

  • New Listings decreased 17.5% to 1,090
  • Pending Sales increased 22.9% to 833
  • Inventory decreased 23.5% to 17,762

For the month of December:

  • Median Sales Price decreased 6.5% to $145,000
  • Days on Market decreased 2.1% to 141
  • Percent of Original List Price Received increased 1.7% to 90.6%
  • Months Supply of Inventory decreased 33.3% to 4.8

Click here for the full Weekly Market Activity Report.

From The Skinny.