
“While perhaps we won’t match the growth in the market seen over the last few years, stability and sustainability are the primary objectives.”
Monthly Archives: June 2019
Weekly Market Report
 For Week Ending June 15, 2019
As anticipated, the Federal Reserve did not change the target range for the federal funds rate (currently set at 2.25% to 2.5%) during their most recent meeting, but the door was left open for a possible rate reduction in 2019 following a string of increases over the last several years. Although the economy is still performing well due to low unemployment and solid retail sales, trade tensions, slowed manufacturing and meek business investments have created uncertainty.
In the Twin Cities region, for the week ending June 15:
- New Listings remained flat at 2,069
- Pending Sales decreased 2.0% to 1,463
- Inventory increased 1.0% to 11,687
For the month of May:
- Median Sales Price increased 5.2% to $285,000
- Days on Market decreased 4.3% to 45
- Percent of Original List Price Received decreased 0.2% to 100.0%
- Months Supply of Homes For Sale increased 4.3% to 2.4
All comparisons are to 2018
Click here for the full Weekly Market Activity Report. From MAAR Market Data News.
Early 2019 Weakness Proving Temporary; Market Back On Track
June 18, 2019
There have been two disruptions to the housing market over the last nine months, but their effects are proving short-lived. First, a sudden increase in interest rates in late 2018 weighed on December and January sales activity. Second, record snow and the subsequent melt in February and March of this year weighed on sales activity in March and April. But May numbers are showing growth in seller activity, pending and closed buyer activity as well as quicker market times and rising prices.
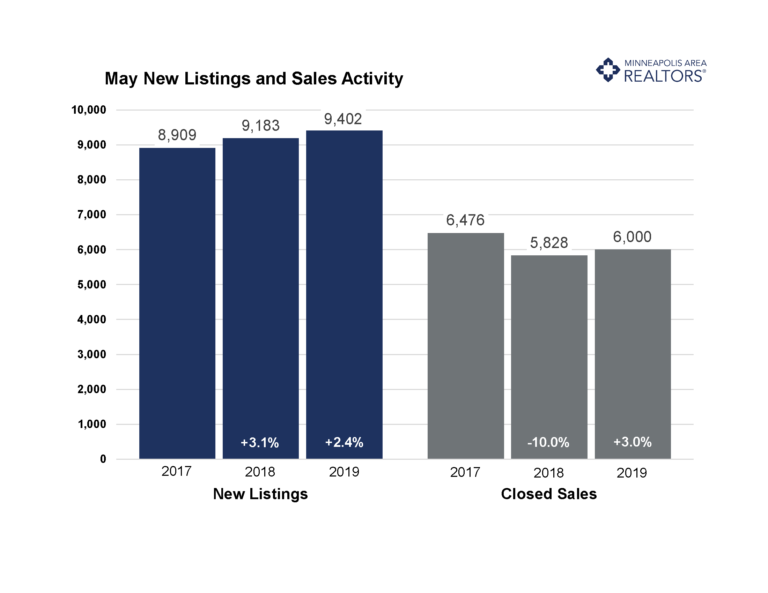
Prices reached a new all-time high of $285,000. New listings rose 2.4 percent while closed sales were up 3.0 percent. After two months of increases, market times sped up by 4.3 percent compared to May 2018. The ratio of sold to list price fell for a fourth consecutive month, but by the smallest amount since February. In conjunction with other indicators, the market is improving for buyers, even though sellers still enjoy strong pricing power, favorable negotiating leverage and quick market times. For the last nine months, buyers have seen more active listings for sale than the year prior. Mortgage rates remain very attractive at around 3.85 percent on a 30-year fixed loan—far lower than anyone predicted by this time. We still have a tale of two markets: strong demand, weak supply and price growth in the affordable brackets but oversupply and slow market times in the upper brackets.
May 2019 by the Numbers (compared to a year ago)
- Sellers listed 9,402 properties on the market, a 2.4 percent increase from last May
- Buyers closed on 6,000 homes, a 3.0 percent increase
- Inventory levels for May increased 0.5 percent compared to 2018 to 11,327 units
- Months Supply of Inventory was flat at 3 months
- The Median Sales Price rose 5.2 percent to $285,000, a record high for any month
- Cumulative Days on Market decreased 4.3 percent to 45 days, on average (median of 17)
- Changes in Sales activity varied by market segment
- Single family sales rose 2.7 percent; condo sales rallied 9.9 percent; townhome sales increased 3.1 percent
- Traditional sales increased 4.4 percent; foreclosure sales declined 26.8 percent; short sales fell 28.6 percent
- Previously-owned sales were up 2.9 percent; new construction sales surged 10.5 percent
Quotables
“We’re still seeing some rebalancing, but it just isn’t as dire as some want us to believe,” said Todd Urbanski, President of Minneapolis Area REALTORS®. “Rates under 4.0 percent is a significant motivator for buyers.”
“Not everyone understands that all real estate is local,” said Linda Rogers, President-Elect of Minneapolis Area REALTORS®. “Shifts in other regions have very little impact on our local market dynamics.”
From The Skinny Blog.
Weekly Market Report
For Week Ending June 8, 2019
In terms of relative balance between buyer and seller interests, residential real estate markets across the country continue to perform well on a stage that includes actors such as heightened consumer confidence, wage increases, low unemployment and an economic expansion that is on the verge of being the longest in U.S. history. Well-known players such as increased sales prices and low inventory have recently been joined by fewer new listings in several markets.
In the Twin Cities region, for the week ending June 8:
- New Listings increased 4.1% to 2,187
- Pending Sales decreased 2.0% to 1,467
- Inventory decreased 0.6% to 11,237
For the month of May:
- Median Sales Price increased 5.2% to $285,000
- Days on Market decreased 4.3% to 45
- Percent of Original List Price Received decreased 0.2% to 100.0%
- Months Supply of Homes For Sale increased 4.3% to 2.4
All comparisons are to 2018
Click here for the full Weekly Market Activity Report. From MAAR Market Data News.
Weekly Market Report
For Week Ending June 1, 2019
Despite home prices that seem to be creeping ever upward like unchecked crabgrass, pending sales have been performing well, and new listings are generally keeping up with demand in a manner that is propelling the housing industry forward into weed-free pastures. The Federal Reserve considers 2.0% a healthy inflation rate, but the U.S. is expected to remain below that in 2019, which could prompt as many as three rate cuts this year. In turn, that could boost housing further. Excelsior!
In the Twin Cities region, for the week ending June 1:
- New Listings increased 1.2% to 1,839
- Pending Sales increased 6.3% to 1,558
- Inventory remained flat at 11,018
For the month of April:
- Median Sales Price increased 5.2% to $281,000
- Days on Market increased 7.5% to 57
- Percent of Original List Price Received decreased 0.5% to 99.4%
- Months Supply of Homes For Sale increased 5.0% to 2.1
All comparisons are to 2018
Click here for the full Weekly Market Activity Report. From MAAR Market Data News.
Weekly Market Report
For Week Ending May 25, 2019
The venerable open house is a home-selling marketing tactic that is as old as the business of real estate. Put arrow signs up on busy street corners; buy some balloons; lay out flyers and snacks; welcome the stream of curious lookie-loos that traipse through the home. Many REALTORS® skip this old-fashioned tactic these days, focusing more on Internet marketing, but there are still a lot of arrow signs on street corners this time of year.
In the Twin Cities region, for the week ending May 25:
- New Listings increased 1.2% to 1,839
- Pending Sales increased 6.3% to 1,558
- Inventory remained flat at 11,018
For the month of April:
- Median Sales Price increased 5.2% to $281,000
- Days on Market increased 7.5% to 57
- Percent of Original List Price Received decreased 0.5% to 99.4%
- Months Supply of Homes For Sale increased 5.0% to 2.1
All comparisons are to 2018
Click here for the full Weekly Market Activity Report. From MAAR Market Data News.
Weekly Market Report
For Week Ending May 18, 2019
There is a stillness in the air during this spring’s housing market, and not the foreboding kind that precedes a scary moment in a horror film or a major weather event, but rather a sameness to the springs of the last few years. Prices are still edging upwards and providing affordability challenges for many buyers. The number of new listings and homes for sale are still not quite enough – though improving – to meet current demand. And competition for desirable homes is still fierce.
In the Twin Cities region, for the week ending May 18:
- New Listings decreased 5.9% to 2,147
- Pending Sales decreased 5.8% to 1,395
- Inventory increased 1.0% to 10,553
For the month of April:
- Median Sales Price increased 5.2% to $281,000
- Days on Market increased 5.7% to 56
- Percent of Original List Price Received decreased 0.5% to 99.4%
- Months Supply of Homes For Sale increased 5.0% to 2.1
All comparisons are to 2018
Click here for the full Weekly Market Activity Report. From MAAR Market Data News.