Weekly Market Report

For Week Ending August 20, 2016

While existing home sales have recently been down, new home sales are picking up across the nation, which, in turn, has coaxed an upward trend in building activity. Buyers are still showing a willingness to pay higher prices, and there are signs that many new homes being built are smaller starter homes, perfect for young adults entering the market.

In the Twin Cities region, for the week ending August 20:

  • New Listings increased 5.6% to 1,575
  • Pending Sales increased 2.0% to 1,251
  • Inventory decreased 17.3% to 14,559

For the month of July:

  • Median Sales Price increased 6.6% to $239,900
  • Days on Market decreased 14.3% to 54
  • Percent of Original List Price Received increased 0.8% to 98.4%
  • Months Supply of Inventory decreased 21.1% to 3.0

All comparisons are to 2015

Click here for the full Weekly Market Activity Report. From The Skinny Blog.

Weekly Market Report

For Week Ending August 13, 2016

Residential construction, builder confidence and housing starts have all been up in recent months, creating a triple dose of good news as the country begins the inevitable home sales slowdown following the busy spring and summer seasons. The news creates hope that buyer traffic could maintain at a sufficient level over the last several months of the year.

In the Twin Cities region, for the week ending August 13:

  • New Listings decreased 5.5% to 1,651
  • Pending Sales decreased 2.8% to 1,229
  • Inventory decreased 17.3% to 14,521

For the month of July:

  • Median Sales Price increased 6.6% to $239,900
  • Days on Market decreased 14.3% to 54
  • Percent of Original List Price Received increased 0.8% to 98.4%
  • Months Supply of Inventory decreased 21.1% to 3.0

All comparisons are to 2015

Click here for the full Weekly Market Activity Report. From The Skinny Blog.

Weekly Market Report

For Week Ending August 6, 2016

Housing markets across the nation have mostly reached full recovery and are even approaching or achieving categorical highs in sales and prices, yet builders are still focusing on higher-end homes over starter homes in order to combat high land and building permit costs. Until there is more entry-level inventory on the market, sustainable balance will be difficult.

In the Twin Cities region, for the week ending August 6:

  • New Listings increased 2.3% to 1,795
  • Pending Sales decreased 1.9% to 1,258
  • Inventory decreased 17.7% to 14,495

For the month of July:

  • Median Sales Price increased 6.6% to $239,900
  • Days on Market decreased 14.3% to 54
  • Percent of Original List Price Received increased 0.8% to 98.4%
  • Months Supply of Inventory decreased 21.1% to 3.0

All comparisons are to 2015

Click here for the full Weekly Market Activity Report. From The Skinny Blog.

Twin Cities Homes Selling in Record Time, But Key Differences Persist

By Aubray Erhardt on Friday, August 12th, 2016

Seller activity declined 5.5 percent since last July, as sellers introduced 7,522 new listings to the marketplace. Sales activity was slightly below year-ago levels. Closed sales fell 5.8 percent while pending sales—the number of signed purchase agreements—fell 3.1 percent. Buyers signed 5,560 new contracts and closed on 6,030 homes. That closed sales figure is on par with July 2003 levels. The July median sales price retreated slightly since June 2016, but increased 6.6 percent from July 2015 to $239,900. Mostly due to inventory constraints, prospective sellers are concerned about their ability to secure their next property in the current environment. Buyers saw little supply side relief, as inventory levels fell 18.1 percent to 14,457 active properties. The well-known inventory shortages haven’t slowed down buyers much, given June 2016 closed sales at a 12-year high.

historical-702x204

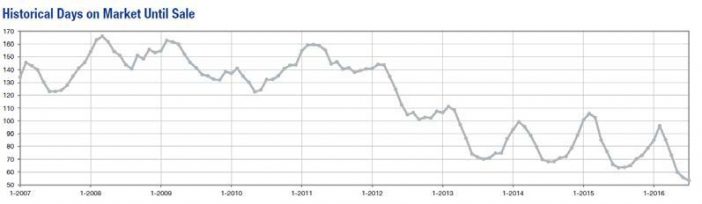
Low inventory, however, has helped draw out stronger offers. The average percent of original list price received at sale was 98.4 percent, the highest figure for any July since 2005. Low levels of for-sale housing also means the homes on the market tend to sell quickly. Cumulative days on market until sale fell 15.9 percent to 53 days. That’s the fastest market time for any month since the beginning of 2007. Months supply of inventory fell 23.7 percent to 2.9 months—the lowest July figure on record going back to the beginning of 2003. Generally, five to six months of supply is considered a balanced market.

MAAR-July-2016-Stats-News-Release-702x174

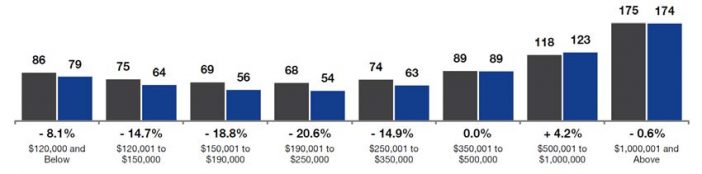
Our days on market indicator tells us that most homes are selling pretty quickly,” said Judy Shields, Minneapolis Area Association of REALTORS® (MAAR) President. “But that market-wide figure leaves out important differences between various communities, property types and price points. For example, the July market-wide average was 53 days but homes priced above $1 million are spending 174 days on the market.”

Over the last 12 months, properties in the $190,000 to $250,000 range have tended to sell the quickest, at an average of 54 days. As the price point rises, so does the amount of time spent on the market. There is a sweet spot whereby both lower and higher priced homes take longer to sell.

It’s also worth noting that the average market time figure can be skewed by properties that linger on the market. The median days on market was actually 25 for July, reflecting the mid-point where half the homes spent longer than 25 days on the market and half spent less.

“Those selling properties above the $500,000 mark know that patience is a virtue even in our current environment,” said Cotty Lowry, MAAR President-Elect. “The supply-demand balance in that segment is less competitive than the entry-level price points, plus consumers are limiting how much house they buy.”

From The Skinny Blog.

Weekly Market Report

For Week Ending July 30, 2016

It’s only August, but this time during summer usually means making plans for changes ahead, especially the start of a new school year. For potential home buyers with school-aged children, these are the pivotal days for deciding whether or not to purchase or wait. With inventory as low as it is, we are in a place where big moves will be made or saved for later, and sales figures will reflect as much.

In the Twin Cities region, for the week ending July 30:

  • New Listings increased 3.3% to 1,723
  • Pending Sales decreased 4.6% to 1,289
  • Inventory decreased 18.0% to 14,588

For the month of July:

  • Median Sales Price increased 6.6% to $239,900
  • Days on Market decreased 15.9% to 53
  • Percent of Original List Price Received increased 0.8% to 98.4%
  • Months Supply of Inventory decreased 23.7% to 2.9

All comparisons are to 2015

Click here for the full Weekly Market Activity Report. From The Skinny Blog.

Weekly Market Report

For Week Ending July 23, 2016

Homes are selling faster now than they have in the past six to seven years, resulting in the need for buyers to move quickly on a home purchase. Although high prices usually encourage more sellers to come forth, people have proven hesitant to put their homes on the market due to concerns about being able to find their own new and reasonably priced home.

In the Twin Cities region, for the week ending July 23:

  • New Listings increased 1.3% to 1,826
  • Pending Sales decreased 4.6% to 1,298
  • Inventory decreased 18.0% to 14,546

For the month of June:

  • Median Sales Price increased 5.3% to $242,000
  • Days on Market decreased 16.7% to 55
  • Percent of Original List Price Received increased 1.0% to 98.7%
  • Months Supply of Inventory decreased 23.7% to 2.9

All comparisons are to 2015

Click here for the full Weekly Market Activity Report. From The Skinny Blog.