Weekly Market Report

For Week Ending July 16, 2022

Increasing homeownership costs have led many prospective homebuyers to continue renting, adding additional pressure to an already highly competitive rental market. Rental vacancy rates have remained below 6% since Q3 2021, a 3-decade low, the U.S. Census Bureau reports. As demand continues to outpace supply, rents on new leases have surged 14.1% this year through June, according to Apartment List, a huge leap from the typical 2% – 3% annual rent increases before the pandemic.

IN THE TWIN CITIES REGION, FOR THE WEEK ENDING JULY 16:

  • New Listings decreased 11.5% to 1,750
  • Pending Sales decreased 24.8% to 1,097
  • Inventory increased 10.1% to 8,441

FOR THE MONTH OF JUNE:

  • Median Sales Price increased 8.6% to $380,000
  • Days on Market increased 5.0% to 21
  • Percent of Original List Price Received decreased 0.8% to 103.3%
  • Months Supply of Homes For Sale increased 23.1% to 1.6

All comparisons are to 2021

Click here for the full Weekly Market Activity Report. From MAAR Market Data News.

Buyers grapple with affordability challenges amidst rising rates and home prices

  • Median sales price reached a record $380,000 despite declining sales
  • June inventory up 9.8 percent, a second consecutive year-over-year increase
  • Softer demand led to longer days on market, up 5.0 percent to 21 days, on average

(July 18, 2022) – According to new data from Minneapolis Area REALTORS® and the Saint Paul Area Association of REALTORS®, Twin Cities home prices rose as sellers continued receiving strong offers despite slightly longer market times. Meanwhile, buyers signed 18.4 percent fewer purchase agreements than last year. While these signal a rebalancing marketplace, the persistent shortage of homes in the region should keep prices resilient.

Home Prices & Sales

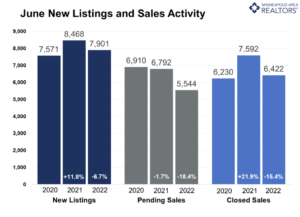
The median home price hit a record $380,000 last month, an 8.6 percent increase from last June and a 23.4 percent increase since the beginning of the pandemic in June of 2020. For the last few years, historically low mortgage rates have offset the effect of rising prices on monthly payments. With rates recently moving from under 3.0 percent to 5.5 percent, the impact of rising prices has increased monthly payments. “While buyers should know that mortgage rates are still well below their long-term average, the increase in rates has had a real impact,” said Denise Mazone, President of Minneapolis Area REALTORS®. “Today’s buyers are more sensitive to that.” Indeed, the housing affordability index reached its lowest level since at least 2004. Buyers signed 5,544 purchase agreements last month, 18.4 percent fewer than last June. That’s the lowest June figure since 2014. But, the decline can be misleading because it’s compared to a uniquely strong market last year. Comparing to pre-pandemic levels, June closings were down just 3.6 percent from June 2019.

Inventory & Listings

A silver lining of moderating buyer activity is its effect on the inventory shortage throughout the region. The metro ended June with 8,020 homes for sale, 9.8 percent more than last June. Inventory gains have been rare, but with a mere 1.6 month’s of supply, buyers are thirsty for more choices. “It’s reassuring to see more homes on the market after a few years of under 2.0 months of supply,” according to Mark Mason, President of the Saint Paul Area Association of REALTORS®. “That said, the gain came mostly from fewer buyers and not more sellers, so we still need more supply and more building activity to balance out the market.” While the Twin Cities saw demand weaken, seller activity was more stable. New listings were down 6.7 percent from last year, with 7,901 homes coming on the market. But relative to June 2020, seller activity increased 4.4 percent.

Location & Property Type

Market activity varies by area, price point and property type. New home sales fell 12.1 percent while existing home sales were down 15.1 percent. Single family sales fell 13.8 percent, condo sales declined 24.5 percent and townhome sales were down 15.1 percent. Sales in Minneapolis decreased 21.7 percent while Saint Paul sales fell 15.8 percent. Cities like Rogers, Minnetrista, and Waconia saw the largest sales gains while New Richmond, Apple Valley, and Farmington had lower demand than last year.

June 2022 Housing Takeaways (compared to a year ago)

  • Sellers listed 7,901 properties on the market, a 6.7 percent decrease from last June
  • Buyers signed 5,544 purchase agreements, down 18.4 percent (6,422 closed sales, down 15.4 percent)
  • Inventory levels grew 9.8 percent to 8,020 units
  • Month’s Supply of Inventory rose 23.1 percent to 1.6 months (4-6 months is balanced)
  • The Median Sales Price rose 8.6 percent to $380,000
  • Days on Market rose 5.0 percent to 21 days, on average (median of 8 days, up 14.3 percent)
  • Changes in Sales activity varied by market segment
    • Single family sales decreased 13.8 percent; Condo sales were down 24.5 percent & townhouse sales fell 15.1 percent
    • Traditional sales declined 15.2 percent; foreclosure sales rose 39.1 percent; short sales were up 100.0 percent (from 4 to 8)
    • Previously owned sales decreased 15.1 percent; new construction sales decreased 12.1 percent


From The Skinny Blog.

Weekly Market Report

For Week Ending July 9, 2022

Homebuyers felt a tinge of relief recently as mortgage rates softened somewhat, with the 30-year fixed-rate mortgage falling from 5.7% to 5.3% the week ending July 7, the biggest one week decline since 2008, according to Freddie Mac. Over the past two weeks mortgage rates have dropped by half a percent, making homebuying about 5% more affordable than last month and saving buyers approximately $100 in monthly mortgage payments, according to the National Association of REALTORS®.

IN THE TWIN CITIES REGION, FOR THE WEEK ENDING JULY 9:

  • New Listings decreased 18.3% to 1,481
  • Pending Sales decreased 19.0% to 931
  • Inventory increased 12.0% to 8,123

FOR THE MONTH OF JUNE:

  • Median Sales Price increased 8.6% to $380,000
  • Days on Market increased 5.0% to 21
  • Percent of Original List Price Received decreased 0.8% to 103.3%
  • Months Supply of Homes For Sale increased 23.1% to 1.6

All comparisons are to 2021

Click here for the full Weekly Market Activity Report. From MAAR Market Data News.

Weekly Market Report

For Week Ending July 2, 2022

According to the U.S. Census Bureau, Baby Boomers own 32 million homes, accounting for more than 40% of homes owned nationwide. As the second largest population group continues to age and transitions to other housing options, the Mortgage Bankers Association predicts more than 4 million existing homes will hit the market annually over the next decade, boosting supply and helping to meet the growing homeownership demand of younger generations.

IN THE TWIN CITIES REGION, FOR THE WEEK ENDING JULY 2:

  • New Listings decreased 3.1% to 1,385
  • Pending Sales decreased 26.0% to 1,231
  • Inventory increased 9.8% to 8,209

FOR THE MONTH OF MAY:

  • Median Sales Price increased 9.0% to $375,000
  • Days on Market decreased 4.2% to 23
  • Percent of Original List Price Received increased 0.1% to 104.1
  • Months Supply of Homes For Sale increased 27.3% to 1.4

All comparisons are to 2021

Click here for the full Weekly Market Activity Report. From MAAR Market Data News.

Weekly Market Report

For Week Ending June 25, 2022

Skyrocketing rents and surging homeownership costs are forcing many prospective buyers to remain in the rental market. With the national median existing-home price recently exceeding $400,000, and assuming a down payment of 3.5%, buyers would need to come up with $14,000 down toward the typical median-priced home. That’s a significant challenge for millions of renters, whom have a median savings of $1,500 or less, according to Harvard researchers’ State of the Nation’s Housing 2022 report.

IN THE TWIN CITIES REGION, FOR THE WEEK ENDING JUNE 25:

  • New Listings decreased 4.5% to 1,825
  • Pending Sales decreased 25.0% to 1,221
  • Inventory increased 6.8% to 7,974

FOR THE MONTH OF MAY:

  • Median Sales Price increased 9.0% to $375,000
  • Days on Market decreased 4.2% to 23
  • Percent of Original List Price Received increased 0.1% to 104.1%
  • Months Supply of Homes For Sale increased 27.3% to 1.4

All comparisons are to 2021

Click here for the full Weekly Market Activity Report. From MAAR Market Data News.