
Monthly Archives: April 2016
It’s Going DOM For Real
By David Arbit on Wednesday, April 27th, 2016
We don’t often talk about the national housing market, because, well, that isn’t really a thing. You read that right. There is no national housing market! The same way there is no national weather forecast. You don’t grab an umbrella in Miami based on the weather in Seattle, do you? So why would you base a decision to buy or sell real property in Minneapolis on data from Phoenix, Cleveland, Las Vegas and St. Louis? You wouldn’t. Because that would be silly.
We don’t often talk about the national housing market, because, well, that isn’t really a thing. You read that right. There is no national housing market! The same way there is no national weather forecast. You don’t grab an umbrella in Miami based on the weather in Seattle, do you? So why would you base a decision to buy or sell real property in Minneapolis on data from Phoenix, Cleveland, Las Vegas and St. Louis? You wouldn’t. Because that would be silly.
So from the standpoint of a family or individual in the midst of a local decision-making process, national data is more or less worthless. Worse, it can actually lead to negative outcomes if a local decision was made based on national figures. Perhaps a Case-Shiller report showed that home prices are rising across their 20-city composite index. But that doesn’t mean prices are rising in every neighborhood or city, or even a particular section of a neighborhood. However, when it comes to bench-marking how we’re doing in Minnesota against other states, national-scale market data can play a marginally useful role.
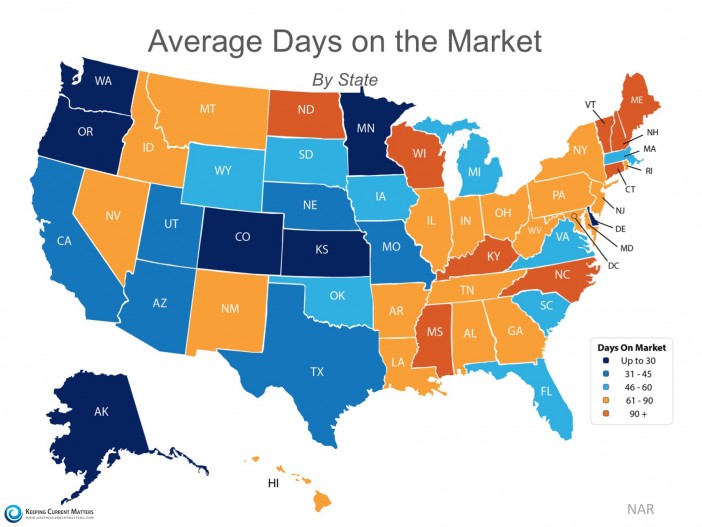
The folks at Keeping Current Matters (KCM) have taken information from NAR’s Monthly REALTOR® Confidence Survey to generate a heat map showing hot spots and cold spots around the country. The darkest blue represents states where homes sell quickly (30 days and under). The darkest orange represents states where homes tend to sell in over 90 days.
As you can see (and as most agents know), Minnesota homes tend to sell quickly. Our state is in the top quintile, among a group of only five other states. It’s a safe bet that our acute inventory shortage plays a large role in this dynamic, but our extremely competitive labor market, attractive business climate, affordable housing stock, high quality of life, diversity, top-notch schools and our treasured parks and water bodies also play a big role in attracting and keeping people here. That translates into strong demand for housing, which—when combined with very low supply levels—means homes tend to sell pretty quickly.
Weekly Market Report

For Week Ending April 16, 2016
Higher home prices and declining months’ supply confirm that it continues to be an excellent time to sell as we start to shift into the heart of the sales season. While construction is expected to pick up and both first-time and move-up buyers are eager to bid for the perfect home, we still need to find a solution for the ongoing problem of low inventory.
In the Twin Cities region, for the week ending April 16:
- New Listings decreased 5.0% to 1,957
- Pending Sales increased 5.9% to 1,506
- Inventory decreased 19.1% to 12,592
For the month of March:
- Median Sales Price increased 5.7% to $222,000
- Days on Market decreased 17.5% to 85
- Percent of Original List Price Received increased 0.9% to 96.8%
- Months Supply of Inventory decreased 28.6% to 2.5
All comparisons are to 2015
Click here for the full Weekly Market Activity Report. From The Skinny Blog.
Weekly Market Report
For Week Ending April 9, 2016
Although inventory is down across the country, many homes that do get listed are selling fast. Days on market is dwindling, and sellers are getting more for their homes than they might have in the past. Confident seller pricing combined with continuously low interest rates for buyers is keeping most markets balanced.
In the Twin Cities region, for the week ending April 9:
- New Listings decreased 6.1% to 1,983
- Pending Sales increased 15.2% to 1,496
- Inventory decreased 18.3% to 12,389
For the month of March:
- Median Sales Price increased 5.7% to $222,000
- Days on Market decreased 17.5% to 85
- Percent of Original List Price Received increased 0.9% to 96.8%
- Months Supply of Inventory decreased 28.6% to 2.5
All comparisons are to 2015
Click here for the full Weekly Market Activity Report. From The Skinny Blog.
Spring Market Draws out Eager Buyers; Sellers Still on Hold
By Aubray Erhardt on Thursday, April 14th, 2016
With the spring market officially underway, both buyer and seller activity rose in March 2016 compared to last March. Buyers signed 5,861 new purchase agreements, pushing pending sales up a respectable 12.6 percent. Would-be sellers were still concerned about their ability to secure their next property in this competitive environment, so new listings only increased 0.5 percent. Hence, supply levels remained near 13-year lows. Compared to last March, inventory levels fell 20.6 percent to 11,893 active properties. Prices continued their disciplined trek back towards levels last seen 10 years ago. The median sales price rose 5.7 percent from last March to land at $222,000. Median list price, by contrast, has already reached and exceeded its previous record, perhaps an indication that the median sales price could do the same this year.
Buyers came out swinging with strong offers in March. Sellers accepted offers closer to their list price, as the percent of original list price received at sale was up to 96.7 percent. Homes tended to sell in less time, with cumulative days on market declining 17.5 percent to 85 days. Months supply of inventory fell 28.6 percent to 2.5 months—the third lowest figure on record going back to 2003. Generally, five to six months of supply is considered a balanced market. While the metropolitan area as a whole is favoring sellers, not all areas, segments or price points necessarily reflect that.
“Between new loan applications and anecdotal evidence, we knew this spring would be another big one for buyers,” said Judy Shields, Minneapolis Area Association of REALTORS® (MAAR) President. “The small gain in seller activity was nice, but it falls well short of the supply levels needed to sustain the demand we’re seeing. That should be motivating for sellers, but it’s still important to understand that your home needs to be priced right.”
It’s also useful to assess specific area and segment performance, since no single property spans the entire metro area nor all market segments and price points. The percentage of sales that were foreclosure or short sale fell to 13.4 percent while traditional pending sales rose 16.2 percent. Single-family homes continued to dominate sales volume, even though townhomes had the strongest increase in closed sales compared to last March, followed by condos. Previously-owned sales had a stronger performance than new construction. Sales activity in the $200,000 and below range declined 13.8 percent while sales activity between $200,000 and $300,000 rose 10.5 percent and activity above $300,000 rose 3.4 percent. Cities with the highest median home price include North Oaks, Orono, Edina, Plymouth, Chanhassen and Minnetonka.
The national unemployment rate ticked up to 5.0 percent in March—reflecting more confident job-hunters actively seeking work. The most recent wage data is also encouraging—a positive factor that could offset declining affordability brought on by rising prices. Locally, the latest Bureau of Labor Statistics figures show the Minneapolis-St. Paul-Bloomington metropolitan area was among the top eight metros with the lowest unemployment rate. The 30-year fixed mortgage rate is about 3.7 percent compared to a long-term average of about 8.0 percent. Rates took a surprising dive after the Federal Reserve announced the first hike last year. Nevertheless, marginally higher rates are expected in 2016.
“Serious buyers should be prepared to make their strongest offer right up front this spring,” said Cotty Lowry, MAAR President-Elect. “Traffic at open houses is as strong as I can recall, which makes additional options on the supply side of the equation that much more critical.”
Weekly Market Report
For Week Ending April 2, 2016
The forecast is bright with a persistent rise in pending home sales. Low mortgage rates and rising rental prices continue to point buyers into the housing market. In order to maintain home-purchase momentum, the supply of homes for sale must grow.
In the Twin Cities region, for the week ending April 2:
- New Listings increased 15.6% to 1,954
- Pending Sales increased 1.8% to 1,378
- Inventory decreased 19.6% to 12,146
For the month of February:
- Median Sales Price increased 5.7% to $222,000
- Days on Market decreased 17.5% to 85
- Percent of Original List Price Received increased 0.8% to 96.7%
- Months Supply of Inventory decreased 28.6% to 2.5
All comparisons are to 2015
Click here for the full Weekly Market Activity Report. From The Skinny Blog.
Is the Lack of Housing Inventory Taking the Spring Out of Your Market?
By Aubray Erhardt on Monday, April 4th, 2016
It’s no secret that we’re experiencing an inventory shortage. Consumers and real estate professionals are feeling the frustration of a low housing supply after submitting multiple offers without success. This trend is not unique to the Minneapolis and St. Paul area, according to Jonathan Smoke, Chief Economist for Realtor.com:
“The increase in sales is resulting in continued tighter-than-tight supply—measured by NAR to be four months in January… that metric measures the number of months it would take to sell the current inventory of available homes, at the current pace. Six to seven months’ worth of homes on the market is considered normal; four months is cray-cray.”
The present conditions have some professionals wondering what brought us to this point. In an article written by Steve Cook of Real Estate Economy Watch, he lists six reasons that explain what’s keeping owners from selling:
1. One in five homeowners with a mortgage still doesn’t have enough equity to sell.
2. Buyers who bought during the 2004-2006 boom are waiting to make a profit.
3. Inventory shortages are squeezing move-up buyers.
4. There are five million fewer homes to be sold.
5. New home construction was decimated by the housing crash and hasn’t yet recovered.
6. The Boomer timetable has been delayed.
Here are some ideas that might help sellers or real estate professionals adapt to changing conditions:
1. Know your market. Each area is unique and it’s important to stay informed so you can anticipate possible changes. Use MAAR’s market reports or InfoSparks to find the most recent numbers.
2. Be honest and up front. You can’t control the market but you may prevent some disappointment or unreasonable expectations by giving an accurate picture of the market on the front end.
3. Be Prepared to Act Fast. When entering into a multiple offer situation it’s important to have finances in order and be prepared to make quick decisions.
4. Focus on the positive. David Arbit, MAAR’s Director of Research and Economics recently reported that job and wage growth trends remain encouraging. The unemployment rate continues to decline and we’re steadily producing sufficient private jobs to absorb newcomers to the labor force. Wages are growing at their fastest pace in years—an encouraging sign that should offset declining affordability brought on by rising prices and interest rates. Locally, the latest Bureau of Labor Statistics figures show the Minneapolis-St. Paul-Bloomington metropolitan area had the second lowest unemployment rate of any major metro area at 3.1 percent compared to 4.9 percent nationally. Mortgage rates are still below 4.0 percent compared to a long-term average of about 8.0 percent. Rates actually went down after the Federal Reserve’s December hike, though marginally higher rates are expected this year.
5. Serve as a resource. At the end of the day, it is the client’s decision on whether or not they choose to sell. However, real estate professionals should provide the resources necessary to help their client make the most informed decision (market stats, financing, pricing, marketing, etc.).
Judy Shields, Minneapolis Area Association of REALTORS® (MAAR) President has shared her perspective on the situation:
“This spring market will be a telling one for a number of reasons. Many would-be buyers are waiting on sellers. Early indicators such as mortgage applications suggest demand is only likely to strengthen. The uncertainty comes on the supply side, but there’s a good chance we’ll see more inventory this year.”
As the spring season unfolds, we can prepare for the unexpected and work within the current market conditions. Low supply levels are likely to persist in the near term, but it’s important to note that buyers are still finding quality homes—perhaps with a bit of patience and persistence. Hang in there. It’s well worth it.
Sources:
6 Ways to Explain Low Inventory
DAILY REAL ESTATE NEWS | WEDNESDAY, MARCH 23, 2016
Where Have All the Sellers Gone?
REAL ESTATE ECONOMY WATCH | MARCH 17, 2016
Weekly Market Report
For Week Ending March 26, 2016
With spring comes the welcoming of another season: the annual springtime seller’s market. Low inventory levels nationwide are inching sales prices higher and dropping the number of days that homes are staying on the market. With interest rates remaining unexpectedly low, there is even more incentive for buyers to competitively bid on new listings.
In the Twin Cities region, for the week ending March 26:
- New Listings decreased 15.9% to 1,488
- Pending Sales increased 4.4% to 1,384
- Inventory decreased 17.9% to 12,214
For the month of February:
- Median Sales Price increased 3.5% to $207,000
- Days on Market decreased 9.4% to 96
- Percent of Original List Price Received increased 1.1% to 95.2%
- Months Supply of Inventory decreased 25.0% to 2.4
All comparisons are to 2015
Click here for the full Weekly Market Activity Report. From The Skinny Blog.