Weekly Market Report

So far this summer, housing has achieved a soft, warm glow. If healing growth in the economy and labor markets persists, housing will be more than ready to weather tapering Fed activity – regardless of when it comes. Both local and national market indicators can’t yet contradict any confidence in rising home prices or dwindling inventory supplies. Let’s take a look into your locale to see how residential real estate is faring.

In the Twin Cities region, for the week ending August 17:

  • New Listings increased 27.8% to 1,643
  • Pending Sales increased 8.7% to 1,173
  • Inventory decreased 10.1% to 16,124

For the month of July:

  • Median Sales Price increased 16.8% to $208,000
  • Days on Market decreased 31.4% to 72
  • Percent of Original List Price Received increased 2.6% to 97.5%
  • Months Supply of Inventory decreased 19.6% to 3.7

Click here for the full Weekly Market Activity Report.From The Skinny.

August Monthly Skinny Video

Where has the Twin Cities real estate market been and where is it heading? This monthly summary provides an overview of current trends and projections for future activity. Narrated by David Arbit (Research Manager, Minneapolis Area Association of REALTORS® & 10K Research), video produced by Chelsie Lopez.

Weekly Market Report

In the world of costs and benefits, no good deed goes unpunished and every rain cloud has a silver lining. The Commerce Department recently reported that consumer retail spending had risen the most in seven months. That bodes well for residential real estate – an industry sensitive to consumer confidence and spending levels.

But it could force the Federal Reserve’s hand in tapering stimulatory monetary policy sooner than later, something that could push interest rates off their current lows.

In the Twin Cities region, for the week ending August 10:

  • New Listings increased 19.1% to 1,650
  • Pending Sales increased 10.1% to 1,197
  • Inventory decreased 11.3% to 15,990

For the month of July:

  • Median Sales Price increased 16.8% to $208,000
  • Days on Market decreased 31.4% to 72
  • Percent of Original List Price Received increased 2.6% to 97.5%
  • Months Supply of Inventory decreased 21.7% to 3.6

Click here for the full Weekly Market Activity Report.From The Skinny.

Traditional (Non-Bank) Activity Driving the Housing Market Up

6a00e54ee9620b88340192ac7fffe5970d-800wi
The Twin Cities were once again buzzing with housing activity in July. Rising rents combined with still-favorable prices and mortgage rates have resulted in ongoing housing recovery. House hunters continue to eye seller activity for hints of additional inventory. New listings rose a healthy 24.6 percent, the second-largest gain since April 2010. Buyers have 15,671 properties from which to choose – 13.0 percent fewer than in July 2012 but still marking the smallest year-over-year decline in inventory in more than two years.

The overall median sales price was $208,757, up 17.2 percent compared to July 2012. A shift in sales type is driving this price growth. As recently as July 2011, foreclosures and short sales together comprised 45.4 percent of all sales activity. In July 2013, these two distressed segments made up just 20.6 percent of all sales. On the seller side, the percentage of all new listings that were distressed in July fell to 17.9 percent, down from 41.2 percent in July 2011.

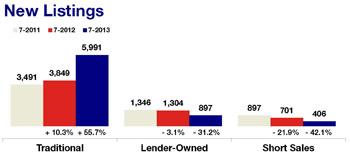
New listings were up 24.6 percent overall, but traditional seller activity surged 55.7 percent – the most in nearly ten years. Foreclosure new listings decreased 31.2 percent and short sale new listings fell 42.1 percent. With 17 straight months of year-over-year median price gains, multiple-offer situations and just 3.6 months’ supply of inventory, the same market that recently favored buyers is now tilting toward sellers. Homes are selling in an average of 72 days – the quickest pace in six and a half years. Sellers are receiving an average of 97.5 percent of their original list price – the highest ratio in just over seven years.

The traditional median sales price rose 3.6 percent to $224,900; the foreclosure median sales price was up 11.6 percent to $135,000; the short sale median sales price increased 18.6 percent to $153,000. On average, traditional homes sold in 62 days for 97.6 percent of original list price, foreclosures sold in 83 days for 98.3 percent of original list price and short sales lagged at 166 days and 93.8 percent of original list price.