Higher rates continue to cool demand, home prices still on the rise

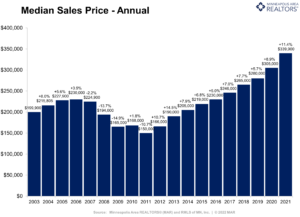
  • Median sales price was up 7.1 percent to $375,000, the slowest increase since June 2020
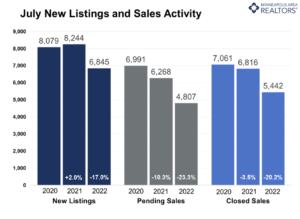
  • Buyer activity was down, pending sales fell 23.3 percent
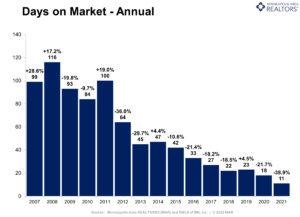
  • Homes took 22 days to sell, 15.8 percent longer than the 19 days last July

(August 15, 2022) – According to new data from Minneapolis Area REALTORS® and the Saint Paul Area Association of REALTORS®, buyers in the Twin Cities have struggled to keep pace with the highs of 2021. Pending sales were down 23.3 percent in July compared to last year as buyers signed 4,807 purchase agreements. Buyers have been hampered by increased mortgage rates, still-low inventory, strong home prices and some economic uncertainty.

Sales & Listings

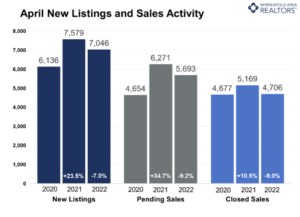
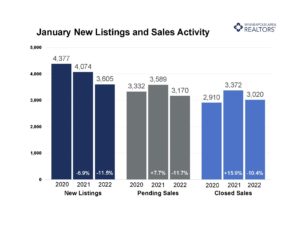
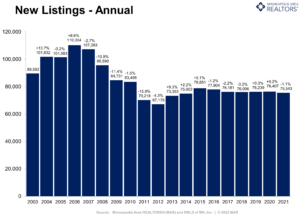
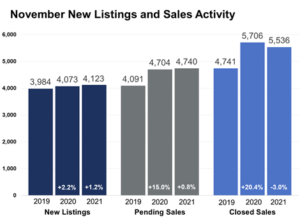
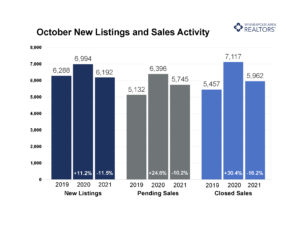
Buyer activity has been softening for 11 of the last 12 months as most acknowledge the frenzied demand of 2020 and 2021couldn’t last. July’s pending sales volume was 12.8 percent lower than July of 2019, reflecting affordability and supply challenges but also hinting at how demand was expedited from 2022/3 into 2020/1. “Many Twin Citizens eager to take advantage of historically low rates and purchase a home leapt at the chance,” said Denise Mazone, President of Minneapolis Area REALTORS®. “Combined with rising rates, that’s left a hole in our buyer pool this year, but there is still plenty of pent-up demand for homes. Plus there’s evidence rates are easing somewhat.” There has not been an influx of supply onto the market. Home sellers listed 6,845 homes last month, down 17.0 percent from last July. Selling activity has been fairly stable overall since 2020, but continuously lagging behind the supply needed to fuel the market demand, until the recent slowdown in sales.

Inventory & Home Prices

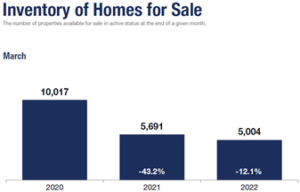
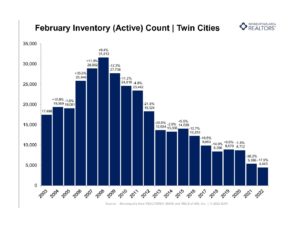
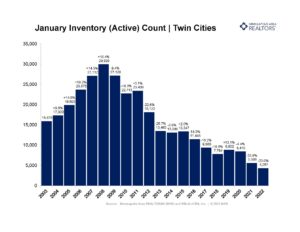
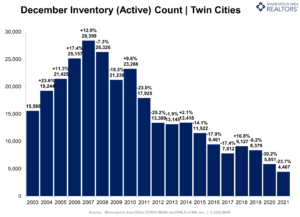
Homes in the metro sold for a median of $375,000 last month, 7.1 percent more than last July. That was the slowest growth rate in two years and amounts to $205 per square foot. The recent downshift in buyer activity has offered a small reprieve for persistent buyers thirsty for inventory and less competition. The metro ended July with 8,694 homes for sale, 4.5 percent more than last July. In a welcome development for buyers, inventory levels have grown for three consecutive months and months supply rose to 1.7. That suggests the supply squeeze is loosening but it’s important to recognize we’re still in a strong seller’s market. “Aspiring home buyers still face competition and multiple offers, just slightly less so than the last couple years, “according to Mark Mason, President of the Saint Paul Area Association of REALTORS®. “So while the market has rebalanced slightly, it still favors sellers.”

Location & Property Type

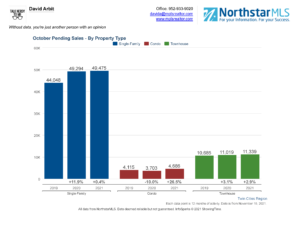
Market activity varies by area, price point and property type. New home sales fell 18.8 percent while existing home sales were down 16.4 percent. Single family sales fell 18.1 percent, condo sales declined 24.5 percent and townhome sales were down 20.8 percent. Sales in Minneapolis decreased 17.5 percent while Saint Paul sales fell 25.0 percent. Cities like Monticello, Golden Valley, and Orono saw the largest sales gains while Stillwater, Chanhassen, and Fridley had lower demand than last year.

July 2022 Housing Takeaways (compared to a year ago)

  • Sellers listed 6,845 properties on the market, a 17.0 percent decrease from last July
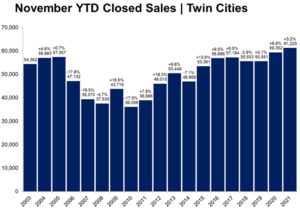
  • Sellers signed 4,807 purchase agreements, down 23.3 percent (5,442 closed sales, down 20.2 percent)
  • Sellers levels grew 4.5 percent to 8,694 units
  • Month’s Supply of Inventory rose 13.3 percent to 1.7 months (4-6 months is balanced)
  • The Median Sales Price rose 7.1 percent to $375,000
  • Days on Market rose 15.8 percent to 22 days, on average (median of 11 days, up 57.1 percent)
  • Changes in Sales activity varied by market segment
    • Single family sales decreased 18.1 percent; Condo sales were down 24.5 percent & townhouse sales fell 20.8 percent
    • Traditional sales declined 18.9 percent; foreclosure sales fell 12.5 percent; short sales were down 14.3 percent
    • Previously owned sales decreased 16.2 percent; new construction sales declined 18.8 percent


From The Skinny Blog.

Buyers grapple with affordability challenges amidst rising rates and home prices

  • Median sales price reached a record $380,000 despite declining sales
  • June inventory up 9.8 percent, a second consecutive year-over-year increase
  • Softer demand led to longer days on market, up 5.0 percent to 21 days, on average

(July 18, 2022) – According to new data from Minneapolis Area REALTORS® and the Saint Paul Area Association of REALTORS®, Twin Cities home prices rose as sellers continued receiving strong offers despite slightly longer market times. Meanwhile, buyers signed 18.4 percent fewer purchase agreements than last year. While these signal a rebalancing marketplace, the persistent shortage of homes in the region should keep prices resilient.

Home Prices & Sales

The median home price hit a record $380,000 last month, an 8.6 percent increase from last June and a 23.4 percent increase since the beginning of the pandemic in June of 2020. For the last few years, historically low mortgage rates have offset the effect of rising prices on monthly payments. With rates recently moving from under 3.0 percent to 5.5 percent, the impact of rising prices has increased monthly payments. “While buyers should know that mortgage rates are still well below their long-term average, the increase in rates has had a real impact,” said Denise Mazone, President of Minneapolis Area REALTORS®. “Today’s buyers are more sensitive to that.” Indeed, the housing affordability index reached its lowest level since at least 2004. Buyers signed 5,544 purchase agreements last month, 18.4 percent fewer than last June. That’s the lowest June figure since 2014. But, the decline can be misleading because it’s compared to a uniquely strong market last year. Comparing to pre-pandemic levels, June closings were down just 3.6 percent from June 2019.

Inventory & Listings

A silver lining of moderating buyer activity is its effect on the inventory shortage throughout the region. The metro ended June with 8,020 homes for sale, 9.8 percent more than last June. Inventory gains have been rare, but with a mere 1.6 month’s of supply, buyers are thirsty for more choices. “It’s reassuring to see more homes on the market after a few years of under 2.0 months of supply,” according to Mark Mason, President of the Saint Paul Area Association of REALTORS®. “That said, the gain came mostly from fewer buyers and not more sellers, so we still need more supply and more building activity to balance out the market.” While the Twin Cities saw demand weaken, seller activity was more stable. New listings were down 6.7 percent from last year, with 7,901 homes coming on the market. But relative to June 2020, seller activity increased 4.4 percent.

Location & Property Type

Market activity varies by area, price point and property type. New home sales fell 12.1 percent while existing home sales were down 15.1 percent. Single family sales fell 13.8 percent, condo sales declined 24.5 percent and townhome sales were down 15.1 percent. Sales in Minneapolis decreased 21.7 percent while Saint Paul sales fell 15.8 percent. Cities like Rogers, Minnetrista, and Waconia saw the largest sales gains while New Richmond, Apple Valley, and Farmington had lower demand than last year.

June 2022 Housing Takeaways (compared to a year ago)

  • Sellers listed 7,901 properties on the market, a 6.7 percent decrease from last June
  • Buyers signed 5,544 purchase agreements, down 18.4 percent (6,422 closed sales, down 15.4 percent)
  • Inventory levels grew 9.8 percent to 8,020 units
  • Month’s Supply of Inventory rose 23.1 percent to 1.6 months (4-6 months is balanced)
  • The Median Sales Price rose 8.6 percent to $380,000
  • Days on Market rose 5.0 percent to 21 days, on average (median of 8 days, up 14.3 percent)
  • Changes in Sales activity varied by market segment
    • Single family sales decreased 13.8 percent; Condo sales were down 24.5 percent & townhouse sales fell 15.1 percent
    • Traditional sales declined 15.2 percent; foreclosure sales rose 39.1 percent; short sales were up 100.0 percent (from 4 to 8)
    • Previously owned sales decreased 15.1 percent; new construction sales decreased 12.1 percent


From The Skinny Blog.

Twin Cities housing supply up for the first time in two years

  • There were 6,766 homes on the market at the end of May, 5.3 percent more than May 2021
  • Median Sales Price reached a record $375,000, up 9.0 percent from last May
  • Pending Sales were down 11.8 percent from last year’s May peak

(June 16, 2022) – According to new data from Minneapolis Area REALTORS® and the Saint Paul Area Association of REALTORS®, the Twin Cities metro area ended the month of May with 6,797 homes, 5.3 percent more homes than last May. This is the first year-over-year inventory increase since March of 2020.

Home Prices & Inventory

Inventory growth in the Twin Cities real estate market has been rare over the last 13 years. Despite record sales in 2021, home buyers were met with fewer listings from which to choose. Since the Great Recession, there have only been three periods with multiple consecutive months of year-over-year supply growth. If continued, the 5.3 percent inventory growth in May could hint at a new trend. Meanwhile the median home price rose 9.0 percent to $375,000. While this does amount to a record high, it’s likely June and July will exceed that level. The housing affordability index reacted to higher prices and rates with a reading of 94, meaning the median income was 94.0 percent of the necessary income needed to qualify for the median priced home under current interest rates. Given more listings and fewer sales, a loosening in inventory could cap price gains, but that takes time to play out and prices are unlikely to soften in the short term. Meanwhile, the metro sits at 1.3 month’s supply of inventory, 18.2 percent more than the year prior. A balanced market has four to six months’ supply. “There’s a sense out there that things are rebalancing somewhat,” said Denise Mazone, President of Minneapolis Area REALTORS®. “But it’s important to remember that we have a long way to go before we’re in oversupply territory so prices should remain firm for now.”

Listings & Sales

The Twin Cities saw increased seller activity in May for the first time this year—a possible indication of a rebalancing market. New Listings rose 3.2 percent to 7,930 homes last month. Growth in new listings is a contributor to higher inventory levels as is the partly rate-driven decline in buyer activity. Pending sales fell 11.8 percent in May as buyers signed purchase agreements on 6,076 homes. Declining year-over-year demand has been a theme all year since we’ve been comparing to the extremely strong 2021 market. Compared to 2020, pending sales were up 4.8 percent. “We may not have the same frenzy as last year, but REALTORS® are still busy compared to pre-pandemic levels,” according to Mark Mason, President of the Saint Paul Area Association of REALTORS®. “Listings are still selling quickly, even with record prices and higher rates.” Half of all homes went under contract in under 7 days, which is even with the year prior. The good news for sellers is that—despite a cooling in demand—buyers offered 4.1 percent over list price on average, a small increase compared to last May.

Location & Property Type

Market activity varies by area, price point and property type. New home sales rose 6.7 percent while existing home sales were down 3.2 percent. Single family sales fell 4.1 percent, condo sales declined 3.8 percent and townhome sales were up 4.0 percent. Sales in Minneapolis decreased 7.0 percent while Saint Paul sales fell 3.5 percent. Cities like Vadnais Heights, Buffalo, and Champlin saw the largest sales gains while Ramsey, St. Michael, and Andover had lower demand than last year.

May 2022 Housing Takeaways (compared to a year ago)

  • Sellers listed 7,930 properties on the market, a 3.2 percent increase from last May
  • Buyers signed 6,076 purchase agreements, down 11.8 percent (5,446 closed sales, down 3.8 percent)
  • Inventory levels grew 5.3 percent to 6,797 units
  • Month’s Supply of Inventory rose 18.2 percent to 1.3 months (4-6 months is balanced)
  • The Median Sales Price rose 9.0 percent to $375,000
  • Days on Market fell 4.2 percent to 23 days, on average (median of 7 days, even with May 2021)
  • Changes in Sales activity varied by market segment
    • Single family sales decreased 4.1 percent; Condo sales were down 3.8 percent & townhouse sales rose 4.0 percent
    • Traditional sales declined 2.7 percent; foreclosure sales fell 7.9 percent; short sales were up 100.0 percent (from 3 to 6)
    • Previously owned sales decreased 3.2 percent; new construction sales increased 6.7 percent


    From The Skinny Blog.

Home prices hit $370,000 as rates push affordability to lowest level since 2004

  • Both pending and closed home sales were down about 9.0 percent from last April
  • Inventory was down 9.2 percent to 5,758 units, the twenty-fifth consecutive month of declines
  • Median Sales Price reached a record $370,000, up 10.0 percent from last year

(May 16, 2022) – According to new data from Minneapolis Area REALTORS® and the Saint Paul Area Association of REALTORS®, the Twin Cities metro area saw rising prices, fast market times and strong offers—often over asking price—during April. But rising mortgage rates have forced the affordability index below 100 for the first time since at least 2004.

HOME PRICES & INVENTORY

While the median home price rose 10.0 percent to reach a new record of $370,000—and will likely do so again over the next couple months—declines in affordability have continued to weigh on some buyers who are already fatigued from writing several offers. Historically low interest rates have been offsetting the effect of rising prices on monthly mortgage payments. But that’s quickly changing as the Federal Reserve races to combat high inflation by raising rates. Even so, the long-term average 30-year fixed mortgage rate is about 8.0 percent, above where we currently stand at around 5.2 percent. The affordability index fell to 95, meaning the median income was 95.0 percent of the necessary income needed to qualify for the median priced home under prevailing interest rates.

Despite affordability concerns, the supply-demand imbalance will likely keep prices firm. Some buyers may need to re-evaluate their target price to keep monthly payments at a level they’re comfortable with. We ended April with 5,758 homes on the market, 9.2 percent fewer than April 2021 and the twenty-fifth straight month of year-over-year inventory declines. This amounts to just 1.1 months’ supply of inventory, giving sellers the upper hand (a balanced market has four to six months’ supply). “Even with several justifiable concerns, this market continues to outperform,” according to Mark Mason, President of the Saint Paul Area Association of REALTORS®.

LISTINGS & SALES

Due to several factors, buyer activity has moderated somewhat. First, we’re comparing against the highs of the Covid housing craze from last spring. Second, inventory is even lower and further pressuring sales. Third, rising rates have likely taken some buyers out of the market. Buyers signed 9.2 percent fewer purchase agreements than April of last year and closed on 9.0 percent fewer homes. Sellers listed 7.0 percent fewer homes than last April. Sellers may feel attached to their interest rate and reluctant to list their homes to avoid higher interest rates.

While still high, it’s possible inflation has peaked. Financial experts report that annual inflation moderated for the first time in months. “It’s the rates and payment piece that is of concern to many of the buyers I work with,” said Denise Mazone, President of Minneapolis Area REALTORS®. “The reality is that people will need to buy and sell homes in any environment, but this really puts pressure on those who are on a budget.” Listings spent 9.7 percent fewer days on market than April 2021 on average. But the median days on market showed half of all homes went under contract in under 8 days, which is even with last April’s pace. This could be a sign of stabilization, yet sellers accepted offers 3.8 percent higher than their list price, on average.

LOCATION & PROPERTY TYPE

Market activity varies by area, price point and property type. New and existing home sales fell 3.5 and 8.0 percent, respectively. Single family sales fell 8.3 percent while condo sales rose 1.5 percent. Sales in Minneapolis declined 3.2 percent while Saint Paul sales fell 17.7 percent. The Longfellow, University, Summit Hill and West Seventh neighborhoods saw the largest sales gains while Hopkins, Mounds View, Wyoming and Somerset also had significant demand increases.

APRIL 2022 BY THE NUMBERS (COMPARED TO A YEAR AGO)

  • Sellers listed 7,046 properties on the market, a 7.0 percent decrease from last April
  • Buyers signed 5,693 purchase agreements, down 9.2 percent (4,706 closed sales, down 9.0 percent)
  • Inventory levels fell 9.2 percent to 5,758 units
  • Month’s Supply of Inventory remained level at 1.1 month (4-6 months is balanced)
  • The Median Sales Price rose 10.0 percent to $370,000
  • Days on Market fell 9.7 percent to 28 days, on average (median of 8 days, same as April 2021)
  • Changes in Sales activity varied by market segment
    • Single family sales decreased 8.3 percent; Condo sales rose 1.5 percent & townhouse sales declined 10.9 percent
    • Traditional sales were down 7.8 percent; foreclosure sales fell 24.2 percent; short sales were up 25.0 percent (from 4 to 5)
    • Previously owned sales declined 8.0 percent; new construction sales fell 3.5 percent

April 2022 HOUSING CHARTS

From The Skinny Blog.

Limited inventory pushes median price over $350,000 as spring market heats up

  • Supply is down during the worst inventory shortage in decades
  • Median Sales Price reaches a record $353,000
  • Median days on market is up marginally compared to the frenzy of 2021

(April 15, 2022) – According to new data from Minneapolis Area REALTORS® and the Saint Paul Area Association of REALTORS®, the Twin Cities metro area set a new record median sales price of $353,000, a 7.5 percent increase from March 2021. Even though that’s the first time the metro-wide median price exceeded $350,000, the rate of increase is 30.0 percent less than it was a year ago. The ongoing inventory shortage is mostly to blame, although the 12.0 percent decline in housing inventory this March was far less than the 43.0 percent decline last March.

LISTINGS & SALES

Last month sellers listed 6,416 homes on the market, 4.8 percent fewer than March 2021, but 4.2 percent greater than 2019. Some aging empty nesters are staying put and aging in place while others have chosen to remodel or expand their current home instead of listing it. Many homeowners are “married” to their interest rates and are reluctant to give up their monthly payments given rising rates. Buyers signed 9.2 percent fewer purchase agreements than March of last year and closed on 10.4 percent fewer homes. The declines partly reflect the unique strength of the 2021 market but also possibly a reaction to increased mortgage rates.

The monthly payment on a $350,000 home with 10.0% down increases by $187 per month when rates move from 4.0 to 5.0 percent. “Some buyers are trying to get ahead of further rate increases,” said Denise Mazone, President of Minneapolis Area REALTORS®. “But the truth is that equity gains over time are likely to outpace the slightly higher payments.” Listings spent 10.3 percent fewer days on market than last March on average, after a 36.1 percent decline the year prior. But the median days on market showed a year-over-year increase for only the third time since September 2019. This could be a sign of a more balanced market. Yet sellers accepted offers 2.7 percent higher than their list price, on average.

HOME PRICES & INVENTORY

Home price are expected to continue rising given a chronically undersupplied market with strong demand, but perhaps at a lesser rate. The median price rose 7.5 percent to $353,000; the average price rose 7.0 percent to $409,754—both record highs. On average, buyers are spending about $200 per square foot. The Twin Cities presently has about four week’s supply of inventory (0.9 months), while a balanced market has roughly four to six months’ supply. But over a decade of underbuilding has meant steep competition for most listings. That coincides with a huge Millennial generation aging into prime homeownership years, not to mention the desire for more space for working and learning from home. Even though inventory levels were down, there are signs that supply is beginning to stabilize. “While inventory levels remain low, there are listings that come on market and go under contract quickly that don’t always show up in the month-end inventory count,” according to Mark Mason, President of the Saint Paul Area Association of REALTORS®.

LOCATION & PROPERTY TYPE

Market activity varies by area, price point and property type. New home sales rose 1.4 percent compared to a 10.5 percent dip for previously owned homes. Single family sales fell 9.3 percent while condo sales were down 5.3 percent. Sales in Minneapolis declined 8.8 percent while Saint Paul sales were down 18.2 percent. Hastings, Hugo and Lino Lakes saw the greatest increase in closed sales while Prior Lake, Richfield and Minnetonka saw sales fall by 35.0 percent or more.

MARCH 2022 BY THE NUMBERS (COMPARED TO A YEAR AGO)

  • Sellers listed 6,416 properties on the market, a 4.8 percent decrease from last March
  • Buyers signed 5,252 purchase agreements, down 9.2 percent (3,934 closed sales, down 10.4 percent)
  • Inventory levels fell 12.1 percent to 5,004 units
  • Month’s Supply of Inventory was down 10.0 percent to 0.9 months (4-6 months is balanced)
  • The Median Sales Price rose 7.5 percent to $353,000
  • Days on Market fell 10.3 percent to 35 days, on average (median of 12 days, up 9.1 percent from March 2021)
  • Changes in Sales activity varied by market segment
    • Single family sales decreased 9.3 percent; Condo sales fell 5.3 percent & townhouse sales declined 10.3 percent
    • Traditional sales were down 9.2 percent; foreclosure sales fell 6.9 percent; short sales were up 28.6 percent (from 7 to 9)
    • Previously owned sales dropped 10.5 percent; new construction sales rose 1.4 percent

MARCH 2022 HOUSING CHARTS

From The Skinny Blog.

Sales begin seasonal upswing, but down from last two unusually strong Februarys

  • Twin Cities saw 3,809 signed purchase agreements, down 10.5 percent from February 2021 but above 2019 levels
  • The number of homes for sale at month-end fell 19.0 percent from last year
  • Median Sales Price rose 8.3 percent to $340,000

(March 15, 2022) – According to new data from Minneapolis Area REALTORS® and the Saint Paul Area Association of REALTORS®, buyer activity in the Twin Cities metro showed its first month-over-month gain since August 2021. As the Covid reshuffle continues to temper, sales are down compared to February of 2020 and 2021, but up from 2019 levels.

LISTINGS & SALES

Buyers signed 10.5 percent fewer purchase agreements than last year and closed on 15.3 percent fewer homes. Since 2020, seller activity has remained especially sluggish—the 4,427 new listings are 18.2 percent fewer than February 2020. While the seasonal uptick toward spring market has begun, it may prove challenging to match activity levels from the prior two years, as the pandemic and the prospect of rising rates shifted activity up from 2022 and 2023 into 2020 and 2021 to accommodate working and learning from home.

“Homes sold more quickly last month than they did last February, and prices rose over 8.0 percent,” said Denise Mazone, President of Minneapolis Area REALTORS®. “While we may not reach the heights of 2020 and 2021, the market remains competitive, homes are still selling rapidly often with multiple bids, and buyers and sellers need to be prepared to move quickly.” Market times have been falling for years, but today’s listings spend even less time on the market. Two years ago, half of the listings went under contract in under 40 days, but last month, half of the listings spent fewer than 19 days on the market. That’s more than a 52.0 percent drop.

HOME PRICES & INVENTORY

The median sales price in the Twin Cities rose 8.3 percent from last February to $340,000. That’s exactly half the 16.6 percent year-over-year rate of price growth seen in May 2021. Rising prices are expected to continue in a persistently undersupplied market with historically strong demand. The Twin Cities presently has about three week’s supply of inventory (0.8 months), where a balanced market would supply four to six months’ worth of homes given recent demand.

Inventory levels dipped 19.0 percent from this time last year. Compounded with a 38.2 percent fall from 2020 to 2021, the metro is facing an inventory shortage that should keep prices strong, market times fast, multiple offers fairly commonplace and some sellers getting above asking price. “Homeowners have gained significant equity, particularly over the last few years,” according to Mark Mason, President of the Saint Paul Area Association of REALTORS®. “Having a knowledgeable advisor to navigate a fast and complex process can help buyers be more competitive and successful.”

LOCATION & PROPERTY TYPE

Market activity varies by area, price point and property type. New construction sales fell 15.5 percent compared to only a 12.2 percent dip in sales of previously owned homes. Single family sales tumbled 9.8 percent while condo sales were down an even 10.0 percent. Between Minneapolis and St. Paul, the latter took the harder hit in sales losses. Saint Paul’s sales were 24.8 percent down compared to Minneapolis’ loss of 15.1 percent. Hastings, Delano and Rush City all had more than double the sales from last year while Hugo, Little Canada and East Bloomington weren’t far behind. Sales fell by around 50.0 percent in Prior Lake, New Hope, Big Lake and Golden Valley.

February 2022 by the numbers compared to a year ago

  • Sellers listed 4,427 properties on the market, a 7.3 percent decrease from last February
  • Buyers signed 3,809 purchase agreements, down 10.5 percent (2,769 closed sales, down 15.3 percent)
  • Inventory levels fell 19.0 percent to 4,361 units
  • Month’s Supply of Inventory was down 20.0 percent to 0.8 months (4-6 months is balanced)
  • The Median Sales Price rose 8.3 percent to $340,000
  • Days on Market fell 8.7 percent to 42 days, on average (median of 19 days, down 5.0 percent from February 2021)
  • Changes in Sales activity varied by market segment
    • Condo sales fell 16.0 percent, single family sales fell 14.8 percent & townhouse sales fell 4.6 percent
    • Traditional sales were down 12.6 percent; foreclosure sales were down 44.4 percent; short sales fell 100.0 percent
    • Previously owned sales dropped 12.6 percent; new construction sales decreased by 15.9 percent

February 2022 housing charts


From The Skinny Blog.

Twin Cities Housing Market Starts off the Year Slowly, For Now

  • Metro-wide Inventory is down 24.2 percent since the start of 2021
  • Month’s Supply of Inventory (absorption rate) is at a record low, ~ 3 weeks of supply
  • Median Sales Price rose 10.4 percent to $332,250

(February 15, 2022) – According to new data from Minneapolis Area REALTORS® and the Saint Paul Area Association of REALTORS®, inventory levels in the Twin Cities metropolitan area have reached a decades-long low of 4,221 homes at the end of January. At the current rate of demand, this inventory would last little more than three weeks without the addition of new listings. The market would require six months of supply in order to be considered balanced.

LISTINGS & SALES

Real estate in the Twin Cities saw a peak of buyer activity throughout 2021, but only now are we able to see the extent of that increased demand. Year over year comparisons of pending sales indicate a noticeable drop of 11.7 percent from last January, but a more historical perspective shows that the 3,170 purchase agreements signed last month are comparable to January of 2019 and 2018. Closed sales show a similar picture, 2022 is not starting off with the same fervor as 2021. The same goes for sellers, resulting in an 11.5 percent drop in supply since last January.

“The year began about as expected, with both sales and listings unable to match their year-ago levels,” said Denise Mazone, President of Minneapolis Area REALTORS®. “But don’t get the wrong idea, the market is expected to remain pretty hot this year as demand continues to outpace supply but also as buyers hope to get ahead of rising rates.”

INVENTORY

While the supply of new listings has historically been a concern for over a decade, the public could usually count on consistent year-over-year activity from sellers until 2020. A sharp fall in supply two summers ago followed by a rebound in 2021 led to variations in seller activity unseen since 2015. Last month sellers listed 3,605 properties on the market, our lowest level of seller activity since 2005.

“It’s important that market participants understand what less than 1.0 month of supply means,” according to Mark Mason, President of the Saint Paul Area Association of REALTORS®. “This means well-priced and attractive listings will sell quickly and often with multiple offers in play. Buyers should be patient but prepared to write strong, non-contingent offers while sellers should be ready to move quickly.”

HOME PRICES

The stark contrast between lackluster seller activity and the remaining rush of demand from buyers leaves the Twin Cities with a housing market where half of its listings last no longer than 21 days, down 4.5 percent from a year prior. This strong seller’s market has driven up the price of listings, now at $332,250 which is the highest January median sales price on record. These market dynamics, if left unchanged, show signs of high market prices and stiff competition for buyers as the weather warms.

LOCATION & PROPERTY TYPE

Market activity varies by area, price point and property type. The condominium market has seen a significant increase in the past year, yet January was the first significant drop in the number of condo sales, down 11.5 percent. New construction has hit a downward trend since last summer and this trend continues with a 6.8 percent decrease in sales. Between Minneapolis and St. Paul, the state capitol city fared better for the first month of the year, seeing a 2.3 percent increase in closed sales while Minneapolis experienced a 16.1 percent drop in sales. The suburban cities that showed the most sales growth in January were Savage (100 percent), Chanhassen (50.0 percent), and Stillwater (45.5 percent) while those that lost the most sales from last year were West Bloomington (- 43.9 percent), Lakeville (- 43.0 percent), and St. Louis Park (- 41.7 percent).

January 2022 by the numbers compared to a year ago

    • Sellers listed 3,605 properties on the market, an 11.5 percent decrease from last January
    • Buyers signed 3,170 purchase agreements, down 11.7 percent (3,020 closed sales, down 10.4 percent)
    • Inventory levels fell 24.2 percent to 4,221 units at month-end
    • Months Supply of Inventory was down 20.0 percent to 0.8 months (4-6 months is balanced)
    • The Median Sales Price rose 10.4 percent to $332,250
    • Days on Market fell 2.4 percent to 41 days, on average (median of 21 days, down 4.5 percent from January 2021)
    • Changes in Sales activity varied by market segment
      • Single family sales fell 11.0 percent; Condo sales declined 11.5 percent & townhouse sales were down 4.5 percent
      • Traditional sales decreased 9.3 percent; foreclosure sales tumbled 32.4 percent; short sales fell 69.2 percent
      • Previously owned sales were 9.9 percent lower; new construction sales were 6.8 percent lower

January 2022 housing charts

From The Skinny Blog.

In 2021 Twin Cities Housing Supply Fell Short Given Historic Demand

Tight supply and record demand pushed prices higher, market times lower and sapped inventory

Minneapolis–Saint Paul, Minnesota (January 24, 2022) – In 2021, housing demand reached a 20-year high while the number of homes for sale hit a 20-year low, according to an annual report issued by Minneapolis Area REALTORS® and the St. Paul Area Association of REALTORS®. That dynamic has been driving virtually every other housing indicator. For sellers, the year brought record prices, blazing fast market times, offers over asking price and a thin market where their homes stood out.“While the year was undeniably strong, we did see sales activity slow and price gains moderate in the second half of the year,” said Mark Mason, President of the Saint Paul Area Association of REALTORS®. “Ten percent price growth or higher simply isn’t sustainable long term. But we do expect the landscape to remain competitive in 2022 after not knowing what to expect the last couple years.”

For buyers, motivation from historically low mortgage rates, a desire for more space for remote work and learning, and an economy recovering from the pandemic crashed right into the supply shortage. These factors have caused some buyer fatigue and raised affordability concerns. The supply-demand imbalance has created a competitive environment where multiple offers are commonplace.

“Some aspiring buyers grew frustrated with a market favoring sellers. I worked with several buyers who wrote upwards of five offers but we kept losing out, particularly in the more affordable segments,” said Denise Mazone, President of the Minneapolis Area REALTORS®. “The [housing] shortage is so persistent. We need about five to six times our current inventory levels just to reach a balanced market. That said, these low mortgage rates have partly offset the effect of rising prices on monthly payments.”

While single family homes make up most of our market, sales of townhomes and condos rose ten times as fast. Labor constraints and supply chain disruptions meant builders listed fewer—and buyers closed on fewer—newly built homes than in 2020. Despite some concerns around forbearances, lender-mediated activity (foreclosures and short sales) declined significantly from already low levels to about half a percent of all sales. 30-year fixed rates started the year at 2.65 percent and ended at 3.1 percent, though they’ve already touched 3.45 percent in 2022 given rising inflation. That could dampen demand in 2022 and restrain price growth which, if combined with an increase in listings, may start to impact market balance. We’ve been in a seller’s market for 10 straight years; perhaps a shift in the power balance is just what disheartened buyers need.

2021 by the Numbers Compared to 2020

  • Sellers listed 75,536 properties on the market, a 1.1 percent decrease from 2020
  • Buyers closed on 66,319 properties, up 2.7 percent (65,937 pending sales, up 0.2 percent)
  • The Median Sales Price rose 11.4 percent to $339,900
  • Inventory levels fell 26.4 percent to 6,742 units on average over the last 12 months
  • Months Supply of Inventory was down 33.3 percent to 1.2 months on average (5-6 months is balanced)
  • Days on Market decreased 34.9 percent to 28 days, on average (median of 11, down 38.9 percent)
  • Changes in Sales activity varied by market segment
    • Single family sales were up 0.8 percent; condo sales grew 25.1 percent; townhome sales increased 2.6 percent
    • Traditional sales rose 3.5 percent; foreclosure sales were down 53.1 percent; short sales fell 51.7 percent
    • Previously owned sales increased 3.7 percent; new construction sales fell 6.2 percent
    • $1M+ luxury sales surged 50.6 percent to a record high

Charting the Market
Seller activity (new listings) was down slightly from 2020 and reached its lowest level since 2014 despite record sales. Some drivers include hesitance around showings during a pandemic, having no place to go, refinancing to a lower rate, weak new construction activity and Baby Boomers aging in place instead of listing their homes. Disheartened buyers have been thirsty for more inventory for years.

Housing demand has rocketed higher over the last two years. Buyers were motivated by a desire for more space to work and learn from home, historically low interest rates, more options due to remote work and maybe even a fear of missing out. The condo and luxury $1M+ sub-markets outperformed other market segments. Sales would’ve undoubtedly been higher if we had sufficient supply.

With supply at a 20-year low and demand at a 20-year high, it’s no surprise the median sales price rose to set a new record. Home prices have risen 126.6% from their low point in 2011 and 47.8% from their prior 2006 peak. Rising prices boost equity and theoretically should motivate some reluctant sellers. But it also gives rise to affordability challenges.


Inventory levels declined almost every year since 2007, bringing housing supply levels down 84.4% from their peak. On average, buyers had 6,800 options during the year and nearly 9,000 in September. This supply-side constraint has led to bidding wars and rising prices. The shortage has frustrated some buyers—particularly at the entry-level price points. More supply is vital to market health and to increase housing opportunities.

Multiple offers—often above asking price—has allowed sellers to yield 101.9% of their asking price. That varied by area, property type and price point. Sellers find that listings stand out in an undersupplied market. Proper pricing was still important for motivated sellers. But a historic high for this ratio of sold to list price reflects highly motivated buyers as well as the imbalance between supply and demand.


Homes are selling at the fastest pace on record. Between May and July, half the homes sold in under a week, but more like 11 days for the year. That’s down 90.5% from 2008. Here again the inventory shortage and historic demand meant buyers pounce on attractive listings right away. Homes didn’t linger on the market for long. Even so, more homes selling in record time and at record prices couldn’t entice more sellers onto the dance floor.

From The Skinny Blog.

Despite a less frenzied marketplace, YTD figures show enduring strength

(December 16, 2021) – According to new data from Minneapolis Area REALTORS® and the Saint Paul Area Association of REALTORS®, the median sales price in the Twin Cities rose 9.4 percent from last November to $339,000. While that’s down from the dizzying gains seen over most of 2021—anywhere from 10.0 to 17.0 percent—the YTD median price is up 11.5 percent to $340,000.New listings ticked 1.2 percent higher from November 2020, the first gain in seller activity since July. If continued—and especially if combined with flattening buyer activity—that could lead to more inventory in 2022. Pending sales also inched higher, up 0.8 percent from last November. Closed sales slid slightly, down 3.0 percent from the heights of 2020 but up considerably from 2019. Notably, despite a decline in closings, a rise in a leading indicator like pending sales indicates strong demand in the pipeline. On a YTD basis, seller activity is down slightly while buyer activity is up modestly.

The Twin Cities just inked its 10th straight year in a metro-wide seller’s market. Relentless demand, tepid listing activity and tight inventory have driven absorption rates down to 1.1 months of supply. Four to six months of supply is considered balanced. Stable demand and rising seller activity is needed for a more balanced marketplace.“We’re seeing more gradual change and less competition compared to last November versus earlier months and we also have over 90.0 percent of 2021 in the books,” said Todd Walker, President of Minneapolis Area REALTORS®. “It looks like sales will hit a new record even as seller activity is weak and inventory is tight.” Up over 11.0 percent so far this year, home prices will also likely hit new highs. That record still hinges on December, when homes tend to take longer to sell and for a lower price. But winter months account for a smaller share of activity and thus have less impact on annual figures. The average market time in November was 30 days, but the median was 16 days. That median is up from 15 days last year. Sellers accepted, on average, 99.8 percent of their list price, down from last year, but still a strong number.

Inventory levels tumbled 18.6 percent compared to a 40.4 percent decline back in May. “While the housing shortage is still very real, there are signs that the ultra-competitive landscape is easing a bit,” according to Tracy Baglio, President of the Saint Paul Area Association of REALTORS®. “But not before we managed to post a new record for closings through November. I expect this to continue as rates remain attractive.”

Market activity varies by area, price point and property type. Home sales doubled in the Cleveland, Windom, Corcoran and Hawthorne neighborhoods, but fell over 50.0 percent in Cooper, Hale and Jordan. Sales in Falcon Heights, Delano, North Branch and Mendota Heights rose over 80.0 percent but fell over 50.0 percent in Wayzata, Medina and Wyoming. Home sales over $1M rose 43.6 percent over the last 12 months. Sales between $150,000 and 190,000 dropped 31.0 percent. Sales in Minneapolis reached their second highest level since 2005. Though a small share overall, condo sales increased more than single family and townhome units.

November 2021 by the numbers compared to a year ago

  • Sellers listed 4,123 properties on the market, a 1.2 percent increase from last November
  • Buyers signed 4,740 purchase agreements, up 0.8 percent (5,536 closed sales, down 3.0 percent)
  • Inventory levels fell 18.6 percent to 6,110 units
  • Month’s Supply of Inventory was down 21.4 percent to 1.1 months (4-6 months is balanced)
  • The Median Sales Price rose 9.4 percent to $339,000
  • Days on Market fell 11.8 percent to 30 days, on average (median of 16 days, up 6.7 percent from November 2020)
  • Changes in Sales activity varied by market segment
    • Condo sales rose 14.7 percent, single family sales fell 0.9 percent & townhouse sales rose 4.6 percent
    • Traditional sales were up 1.5 percent; foreclosure sales were down 52.9 percent; short sales fell 22.2 percent
    • Previously owned sales increased 4.1 percent; new construction sales decreased by 19.2 percent

From The Skinny Blog.

A decade-long seller’s market in the Twin Cities still going strong

(November 16, 2021) – According to new data from Minneapolis Area REALTORS® and the Saint Paul Area Association of REALTORS®, the median sales price in the Twin Cities rose 7.9 percent from October 2020 to $340,000. Despite the housing shortage, price growth is returning to more typical levels even as we mark 10 full years of a sellers’ market.

New listings in the metro fell 11.5 percent from last October and are 1.5 percent below their 2019 level. While pending sales also dipped 10.2 percent from last year, buyer activty is up 11.9 percent from 2019. Closed sales were also down from 2020 but up from 2019. Last month also marked the Twin Cities’ 10th straight year in a metro-wide seller’s market. We’ve had under 5.0 months supply of inventory for every month of every year since November 2011. Over the last year, however, we’ve seen those absorption rates contract to 1.0 month of supply. Six months of supply is considered a balanced market. The three primary drivers of this is strong demand, weak listing activity and tight inventory levels.

“We’re still stuck in this period of apples-to-oranges year-over-year comparisons where we’re up against a uniquely strong pandemic market,” said Todd Walker, President of Minneapolis Area REALTORS®. “And as inflation concerns grow, cash downpayment savings can lose value. As rates rise, it’s possible some buyers move up their purchase timeline.” As we embrace fall and begin to cool down seasonally, listings tend to take longer to sell than in spring or summer. Half of the listings in the metro area sold in fewer than 14 days. While that pace is flat from last year, time on market is down 44.0 percent from 2019, and 14 days is a record fast pace for any October going back to 2007 and likely earlier. Sellers accepted, on average, 100.3 percent of their list price, down slightly from last October.

Inventory levels were down 16.2 percent compared to a 40.5 percent decline back in May. “Pricing has remained firm from all the demand still in the market as well as the supply squeeze,” according to Tracy Baglio, President of the Saint Paul Area Association of REALTORS®. “While still rising, the rate of year-over-year price growth has slowed from 16.6 percent in May to around 8.0 percent last month.”

Market activity varies by area, price point and property type. Home sales more than doubled in Loring Park and Bryant and doubled in the Folwell and Lyndale neighborhoods, but fell between 60.0 and 80.0 percent in Kenwood, Kenny and Armatage. Sales in Centerville rose 83.3 percent and 46.7 percent in Princeton but fell 71.4 percent in Wayzata and 61.3 percent in New Prague. The price range with the largest gain in demand was the $1M+ luxury sector, where sales have surged 47.3 percent over the last 12 months. Sales between $150,000 and 190,000 dropped 30.1 percent. In August, closed sales in Minneapolis reached their highest level since 2005, marking a 16-year high for housing demand in the city. Though a small share overall, condo sales rose more than any other property type over the last year.

October 2021 by the numbers compared to a year ago

  • Sellers listed 6,192 properties on the market, an 11.5 percent decrease from last October
  • Buyers signed 5,745 purchase agreements, down 10.2 percent (5,962 closed sales, down 16.2 percent)
  • Inventory levels fell 16.2 percent to 7,657 units
  • Month’s Supply of Inventory was down 17.6 percent to 1.4 months (4-6 months is balanced)
  • The Median Sales Price rose 7.9 percent to $340,000
  • Days on Market decreased 22.9 percent to 22 days, on average (median of 14 days, level with October 2020)
  • Changes in Sales activity varied by market segment
    • Condo sales rose 3.8 percent, while single family & townhouse sales fell 18.8 percent and 11.5 percent respectively
    • Traditional sales were down 15.5 percent; foreclosure sales were down 61.4 percent; short sales fell 45.5 percent
    • Previously owned sales dropped 14.5 percent; new construction sales decreased by 28.6 percent

    All information is according to the Minneapolis Area REALTORS® and Saint Paul Area Association of REALTORS based on data from NorthstarMLS. We serve the Twin Cities 16-county metro area and western Wisconsin.

    From The Skinny Blog.