Median Price Exceeds $200,000 – Highest Since 2007

6a00e54ee9620b88340191042e2072970c-800wi

In light of a 14.2 percent increase in pending sales, Twin Cities home buyers seem unphased by recent mortgage rate increases. Even with rates around 4.5 percent, the housing stock remains highly affordable by historical comparison. In 25 of the past 26 months, there have been year-over-year gains in pending sales; and the metric is currently at its highest level since June 2006. House hunters are watching seller activity for clues of additional inventory.New listings rose 20.0 percent, the second-largest gain since March 2010. Buyers have 15,193 properties from which to choose – 17.2 percent fewer than in June 2012 but 17.4 percent more than in January 2013.

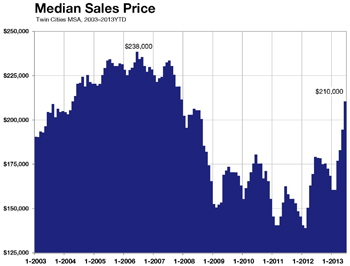
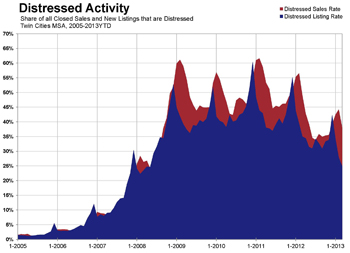
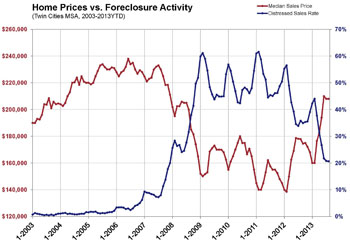
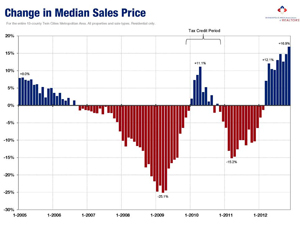
The median sales price for the metro area rose 17.5 percent to $210,000. That’s the highest median sales price since December 2007. A shift in sales types is driving this price recovery. As recently as February 2011, foreclosures and short sales comprised 61.5 percent of all sales activity.

In June 2013, these two distressed segments together comprised just 21.7 percent of all sales. On the seller side, the percentage of all new listings that were distressed in June fell to 16.8 percent, its lowest level since September 2007.

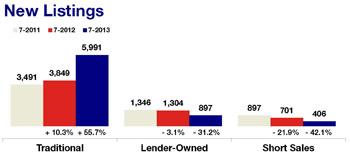
Seller activity was up 20.0 percent overall, but traditional new listings surged 44.4 percent. Foreclosure new listings decreased 24.6 percent and short sale new listings fell 51.7 percent. With 16 straight months of year-over-year price gains, multiple-offer situations and just 3.5 months’ supply of inventory, the same market that recently favored buyers is now tilting toward sellers.

Looking at price movement by segment, the traditional median sales price rose 8.7 percent to $232,000; the foreclosure median sales price was up 16.9 percent to $145,000; the short sale median sales price increased 14.2 percent, also to $145,000.

On average, traditional homes sold in 68 days for 97.7 percent of original list price, foreclosures sold in 71 days for 98.2 percent of original list price and short sales lagged at 156 days and 93.0 percent of original list price.
Pending Sales Levels Highest Since June 2005

Minneapolis, Minnesota (June 12, 2013) – May was an impressive month for the 13-county Twin Cities residential real estate market. With 5,872 pending sales, buyer demand continued its ascent, surging 18.5 percent to its highest level since June 2005. Seller activity was also up, as new listings rose 26.2 percent to 8,332 units, representing the largest gain in new listings since January 2006 and the highest number since April 2010. Buyers have 14,375 properties to choose from – 22.3 percent fewer than in May 2012 but 11.6 percent more than in January 2013.

The median sales price for the metro area rose 15.1 percent to $194,450. That’s the highest median sales price since August 2008. A shift in product type is driving this improvement. As recently as February 2011, foreclosures and short sales occupied 61.5% of all sales activity. In May 2013, these two distressed segments together comprised just 26.9 percent of all sales. The percentage of all new listings that were distressed in May 2013 fell to 18.6 percent, its lowest level since September 2007.

“With the recent disparity between massive buyer demand and sluggish seller supply, it is encouraging to see a substantial increase in traditional listings,” said Andy Fazendin, President of the Minneapolis Area Association of REALTORS® (MAAR).

Although new listings were up 26.2 percent overall, traditional new listings were up 49.9 percent, while foreclosure new listings were down 15.4 percent and short sale new listings were down 43.4 percent. With 15 straight months of year-over-year price gains, multiple-offer situations and just 3.4 months’ supply of inventory, the market landscape that once favored buyers has tilted toward sellers.

The traditional median sales price was up 7.3 percent to $220,000; the foreclosure median sales price was up 18.7 percent to $137,700; the short sale median sales price was up 4.4 percent to $141,000. On average, traditional homes sold in 78 days, foreclosures sold in 87 days and short sales lagged at 174 days.

“This is still about product mix. We once filled our grocery bag with ramen noodles,” said Emily Green, MAAR President-Elect. “Today we’re buying organic, grass-fed sirloin steaks. Grocery prices haven’t increased much, but
the value of what we’re buying has. Traditional homes tend to be of a higher quality and better maintained than foreclosures or short sales.”

Four and a Half Years Since Prices Have Been This High

Minneapolis, Minnesota (May 10, 2013) – The last time the median home price for the Twin Cities 13-county metropolitan area was higher than it was in April 2013 was September 2008, marking the 14th consecutive month of year-over-year price gains. New listings were up 7.7 percent over April 2012 to 7,057 properties, and signed purchase agreements were up 16.0 percent to 5,507.

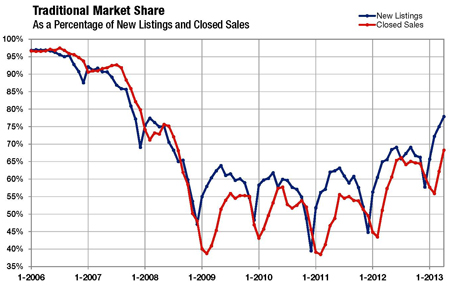
This is the highest pending sales count since May 2006. For the same time period, there were 4,138 closed sales, and inventory levels declined 29.3 percent to 13,113 active listings. Driven by the changing mix of sales, solid demand and falling supply, the median home price for the Twin Cities metro rose 12.2 percent to $182,312. The percentage of all new listings that were traditional, non-distressed homes rose to 77.9 percent, its highest level since October 2007. For closed sales, that figure rose to 68.4 percent, its highest level since July 2008.

Seller activity was up 7.7 percent overall, while traditional new listings were up 28.0 percent, foreclosure new listings were down 25.6 percent and short sale new listings were down 39.5 percent. The 10K Housing Value Index – which controls for data variability – showed an 8.5 percent increase to $181,381. With only 3.1 months supply of inventory, more seller participation in the market is important to continued recovery.

The traditional median sales price was up 8.5 percent to $216,000; the foreclosure median sales price was up 11.7 percent to $134,000; the short sale median sales price was up 5.1 percent to $135,000. Traditional sales sold in 90 days; foreclosures sold in 94 days; short sales sold in 178 days, on average.

All information is according to the Minneapolis Area Association of REALTORS® (MAAR) based on data from the Regional Multiple Listing Service of Minnesota, Inc. MAAR is the leading regional advocate and provider of information services and research on the real estate industry for brokers, real estate professionals and the public. MAAR serves the Twin Cities 13-county metro area and western Wisconsin.

Key Milestones Reached on Road to Recovery

Minneapolis, Minnesota (April 10, 2013) – The 13-county Twin Cities regional housing market has achieved several major accomplishments in recent months and March 2013 was no different. For a 13th consecutive month, homes sold at a higher median price than during the prior year. Additionally, the percentage of all new listings that were traditional, non-distressed homes rose to 75.0 percent, its highest level since May 2008. Several patterns continued from 2012, including increased pending sales, decreased inventory, higher prices and a lighter distressed market.

There were 3,632 closed sales in March 2013, which was roughly even with last year. There were 4,656 pending sales, a 6.6 percent increase over 2012. Inventory levels declined 31.0 percent to 12,615 active listings, marking a new 10-year low. Driven by the changing mix of sales, the median price for the Twin Cities metro rose 17.4 percent to $176,000. More product sold at higher price points.

“We closely monitor the mix of homes that sell,” said Andy Fazendin, President of the Minneapolis Area Association of REALTORS®. “It’s evident that foreclosures and short sales are comprising a smaller share of overall listings and sales compared to recent years. This is great news for the traditional market.”

Although seller activity was down 5.0 percent in the metro area, traditional new listings were up 9.7 percent; foreclosure new listings were down 26.6 percent; short sale new listings were down 42.0 percent.

Since traditional homes sell for about 55.0 percent more than foreclosures, median sales price rose 17.4 percent compared to last year. The 10K Housing Value Index – which controls for data variability – showed a 10.5 percent increase to $182,378. More seller participation in the market will be crucial to ongoing recovery, as many consumers are frustrated by the limited supply of homes for sale. There is evidence that this is improving, as traditional seller activity has been on the rise lately.

Traditional homes represented more than 62.0 percent of all closed sales. Distressed properties made up the remaining 38.0 percent. The traditional median sales price was up 6.1 percent to $209,900; the foreclosure median sales price was up 28.5 percent to $134,900; the short sale median sales price was down 3.0 percent to $130,000.

“Buyers are filling the market pool with the arrival of spring,” said Emily Green, MAAR President-Elect. “Sellers are starting to dip their toes into the water, but we could use some divers.”

Twelve Consecutive Months of Price Gains

Twin Cities homes sold for a higher median price than during the year prior for the 12th consecutive month. This is a significant milestone demonstrating a real and sustainable recovery. Several patterns continued from 2012: pending purchase activity was up, new and existing supply levels were down, prices were higher and distressed market activity eased.

There were 2,736 closed home sales during February 2013, 4.7 percent fewer than February 2012. There were 3,689 pending sales, a 2.0 percent increase over last year. The median sales price rose 15.5 percent to $160,000. Inventory levels declined 31.6 percent to 12,202 active listings, the lowest number for any month going back to January 2003. The number of homes for sale is at a 10-year low.

“We’re watching seller activity almost more than buyer activity,” said Andy Fazendin, President of the Minneapolis Area Association of REALTORS®. “Bank listing activity is down while traditional seller activity is up. That’s an encouraging shift.”

Looking at activity by sale type, traditional closed sales were up 21.5 percent; foreclosure sales were down 23.5 percent; short sales were down 28.5 percent. Since traditional homes sell for about 75.0 percent more than foreclosures, the median sales price rose, as it has for 12 straight months compared to year-ago levels. The 10K Housing Value Index – which controls for data variability – showed a tamer 10.2 percent increase to $179,010. Stronger confidence and less economic uncertainty will encourage more seller activity, thereby increasing the supply of homes for sale. There is evidence this is improving, as traditional seller activity has been on the rise lately.

A healing distressed segment has also facilitated recovery. At 72.3 percent, traditional homes represented more than 70.0 percent of all new listings for the first time since June 2008. Traditional homes also made up 55.4 percent of all closed sales. The traditional median sales price was up 14.2 percent to $205,500; the foreclosure median sales price was up 12.3 percent to $116,522; the short sale median sales price was up 10.1 percent to $127,750.

Months’ supply of inventory fell 40.8 percent to 2.9 months. Figures below 4.0 months suggest we’re in a fledgling seller’s market. Homes sold in 113 days, on average, or 21.5 percent quicker than February 2012. Sellers received 93.7 percent of their list price, on average, up from 90.6 percent last year. Conventional financing comprised 46.7 percent of all closed sales; FHA financing was used on 20.9 percent of sales; cash buyers made up 25.1 percent of sales.

“Judging by the number of inquiries agents are receiving, buyers seem prepared and motivated this spring,” said Emily Green, MAAR President-Elect. “We anticipate an uptick in new listings and we hope it is enough to meet the strength of buyer demand.”

Strong Start to 2013 for Twin Cities Housing Market

While we’re all exercising more and eating better – at least for another week – the local housing market has upheld several important resolutions. Four patterns continued from 2012: buyer demand was up, new and existing supply levels were down, prices were higher and distressed market activity eased. There were 2,797 closed home sales in January 2013, 11.0 percent higher than January 2012. There were 3,456 pending sales, a 13.3 percent increase over last year. Inventory levels declined 32.2 percent to 11,977 active listings, the lowest number for any month going back to January 2003. That marks an official 10-year low.

“Last year, traditional sellers re-entered the market in increasing numbers,” said Andy Fazendin, President of the Minneapolis Area Association of REALTORS®. “With our limited inventory, that’s led consumers to purchase more traditional properties, which sell for roughly 60 percent more than distressed properties.”

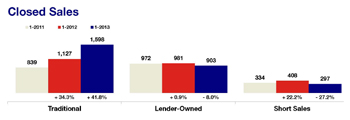
Traditional closed sales, in fact, were up 41.8 percent. That’s helped boost year-over-year median sales price comparisons for 11 straight months. The median home price was up 14.3 percent to $160,000. The 10K Housing Value Index – which adjusts for seasonality and segment bias – showed a tamer 8.2 percent increase to

$175,529. With the number of homes for sale at a 10-year low, seller confidence has become an increasingly vital component to continued housing recovery. There is evidence of improvement on this front, as traditional seller activity has been on the rise.

A healing distressed segment facilitated recovery. Traditional homes comprised 65.9 percent of all new listings, up from 56.3 percent last January, and made up 57.1 percent of all closed sales compared to 44.8 percent last year. In other words, fewer low-priced foreclosures and short sales both entered and sold off the market.

The traditional median sales price was up 3.6 percent to $199,900; the foreclosure median sales price was up 22.5 percent to $124,900; the short sale median sales price was up 2.9 percent to $125,500.

Nine Straight Months of Year-Over Year Price Gains

Despite the dramatic arrival of winter, the housing market has retained much of its summer heat. Three decisive trends continued through November: Buyer activity outperformed year-ago levels, inventory dropped and, for a ninth consecutive month, home prices rose compared to 2011. In simpler terms, more homes sold in less time at higher prices and for closer to asking price than last year. During November, 3,843 homes closed, 20.0 percent higher than November 2011. There were 3,587 pending sales, a 12.6 percent increase over last year.

The median sales price was up 16.9 percent to $173,000. The 10K Housing Value Index showed a more modest 9.1 percent increase to $173,113. The number of homes for sale fell 29.4 percent to 13,860 active listings – the lowest number since January 2003. Consequently, seller sentiment has become even more critical to housing recovery. There is evidence of improvement on this front.

The median sales price has risen for nine consecutive months. Less supply, more demand and a healing distressed segment have enabled this trend. Overall, new listings were up 0.2 percent. However, traditional new listings were up 27.8 percent while foreclosure and short sale new listings fell 21.1 and 45.7 percent, respectively. Thus, a pullback in bank-mediated listings has diluted a significant increase in traditional seller activity.

Similarly, closed sales were up 20.0 percent overall, but traditional sales were up 50.4 percent while foreclosures and short sales were down 14.9 and 2.7 percent, respectively. As for the shifting market share, traditional sales made up 64.2 percent of sales, foreclosures 24.6 percent and short sales 11.2 percent.

Months’ supply of inventory fell 40.6 percent to 3.4 months. Figures below 4.0 months of supply are typically hallmarks of sellers’ markets. Homes tended to sell in 104 days, on average, 25.9 percent quicker than last year. Sellers received 94.3 percent of their list price, on average, up from 90.9 percent last year. Conventional financing comprised 48.5 percent of all closed sales; FHA financing was used on 23.1 percent of sales; cash buyers made up 20.6 percent of sales.

From The Skinny.

Weekly Market Report

Do you hear that? It’s the sound of carts shifting through the back-to-school aisles, filling quickly with notebooks and pencils and glue. It’s the sound of teenagers shuffling through dorms and down storied lanes on their first college orientation. It’s the sound of young professionals readying themselves for their first big job, freshly shorn and tailored. It’s the sound of a family preparing for the leap from the overcrowded apartment to the “starter” home that will see their first into high school. The end of summer sure can seem an awful lot like spring. Let’s see if the housing market says the same.

In the Twin Cities region, for the week ending August 11:

  • New Listings increased 2.0% to 1,387
  • Pending Sales increased 31.2% to 1,149
  • Inventory decreased 29.6% to 16,982

For the month of July:

  • Median Sales Price increased 13.7% to $179,000
  • Days on Market decreased 27.8% to 106
  • Percent of Original List Price Received increased 3.6% to 95.0%
  • Months Supply of Inventory decreased 42.8% to 4.3

Click here for the full Weekly Market Activity Report.

From The Skinny.

Weekly Market Report

Buyer activity: up. Seller activity: down. That could soon change if sellers begin to increase their activity levels entering the spring market. They’ve understandably been a tad shy lately, but the changing landscape is starting to register with well-informed homeowners looking to move. Buyers have shown that they refuse to let one of the most attractive purchase environments pass them by. As activity revs up this spring, not all segments will benefit equally. Which is exactly why the numbers are so central to assessing both the breadth and depth of market recovery.

In the Twin Cities region, for the week ending March 10:

  • New Listings decreased 0.3% to 1,450
  • Pending Sales increased 20.9% to 995
  • Inventory decreased 24.3% to 17,899

For the month of February:

  • Median Sales Price decreased 1.4% to $138,500
  • Days on Market decreased 9.1% to 145
  • Percent of Original List Price Received increased 2.6% to 90.6%
  • Months Supply of Inventory decreased 35.8% to 4.7

Click here for the full Weekly Market Activity Report.

From The Skinny.

Weekly Market Report

The last six years or so have been tough on home prices, and even the most optimistic prognosticators say it will take another six years for median sales prices to approach the halcyon days of assured annual value increases for home sellers. Generations of stable home price increases gave way to a boom-and-bust cycle that would have made the Pets.com sock puppet blush. As we enter what should be an active spring market, our communities would do well to focus effort toward creating healthy, happy homes. With those in place, prices will rise again.

In the Twin Cities region, for the week ending March 3:

  • New Listings decreased 23.2% to 1,402
  • Pending Sales increased 29.7% to 940
  • Inventory decreased 22.9% to 17,818

For the month of February:

  • Median Sales Price decreased 1.1% to $138,500
  • Days on Market decreased 9.0% to 145
  • Percent of Original List Price Received increased 2.6% to 90.6%
  • Months Supply of Inventory decreased 36.5% to 4.6

Click here for the full Weekly Market Activity Report.

From The Skinny.