 Twin Cities home buyers were unflustered by slightly higher interest rates in August as pending sales were up 10.9 percent to 5,244. Along with rising prices, increased sales activity is fueling housing demand, while buyers continue to watch inventory levels for more options.
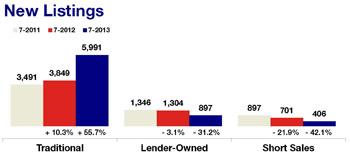
New listings rose 16.5 percent to 6,951, marking the fifth consecutive year-over-year increase in seller activity. Buyers have 15,773 properties from which to choose – 9.9 percent fewer than August 2012 but 21.2 percent more than in January 2013.
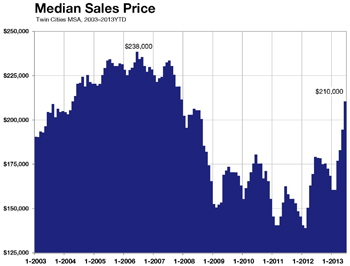
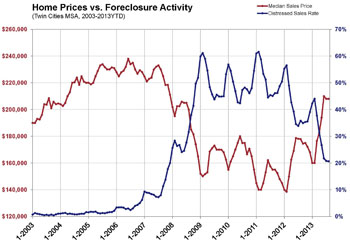
The overall median sales price was $208,000, up 16.9 percent compared to August 2012. A shift in sales type is driving this price growth. At this time last year, foreclosures and short sales together comprised 35.8 percent of all sales activity. In August 2013, these two distressed segments made up just 20.7 percent of all sales. On the seller side, the percentage of all new listings that were distressed in August fell to 17.8 percent, down from 32.7 percent in 2012.
While closed sales were up 8.9 percent overall, traditional buyer activity was up 34.7 percent. Foreclosure sales and short sales were down 34.5 and 43.5 percent, respectively. Similarly, new listings were up 16.5 percent overall, but traditional seller activity rocketed 42.1 percent higher. Foreclosure new listings fell 31.4 percent and short sale new listings fell 46.0 percent. With 18 straight months of year-over-year median price gains, multiple-offer situations still common and 3.6 months’ supply of inventory, few thought that the pendulum would swing this far this fast. Homes are selling in an average of 70 days – the quickest pace in six and a half years. Sellers are receiving an average of 97.0 percent of their original list price – the highest ratio in approximately seven years.
The traditional median sales price rose 3.7 percent to $228,000; the foreclosure median sales price was up 14.1 percent to $140,400; the short sale median sales price increased 13.4 percent to $142,608. On average, traditional homes sold in 62 days for 97.2 percent of original list price, foreclosures sold in 79 days for 97.1 percent of original list price and short sales lagged at 163 days and 94.2 percent of original list price.