Traditional (Non-Bank) Activity Driving the Housing Market Up

6a00e54ee9620b88340192ac7fffe5970d-800wi
The Twin Cities were once again buzzing with housing activity in July. Rising rents combined with still-favorable prices and mortgage rates have resulted in ongoing housing recovery. House hunters continue to eye seller activity for hints of additional inventory. New listings rose a healthy 24.6 percent, the second-largest gain since April 2010. Buyers have 15,671 properties from which to choose – 13.0 percent fewer than in July 2012 but still marking the smallest year-over-year decline in inventory in more than two years.

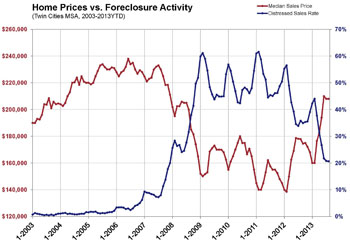
The overall median sales price was $208,757, up 17.2 percent compared to July 2012. A shift in sales type is driving this price growth. As recently as July 2011, foreclosures and short sales together comprised 45.4 percent of all sales activity. In July 2013, these two distressed segments made up just 20.6 percent of all sales. On the seller side, the percentage of all new listings that were distressed in July fell to 17.9 percent, down from 41.2 percent in July 2011.

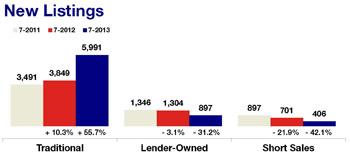
New listings were up 24.6 percent overall, but traditional seller activity surged 55.7 percent – the most in nearly ten years. Foreclosure new listings decreased 31.2 percent and short sale new listings fell 42.1 percent. With 17 straight months of year-over-year median price gains, multiple-offer situations and just 3.6 months’ supply of inventory, the same market that recently favored buyers is now tilting toward sellers. Homes are selling in an average of 72 days – the quickest pace in six and a half years. Sellers are receiving an average of 97.5 percent of their original list price – the highest ratio in just over seven years.

The traditional median sales price rose 3.6 percent to $224,900; the foreclosure median sales price was up 11.6 percent to $135,000; the short sale median sales price increased 18.6 percent to $153,000. On average, traditional homes sold in 62 days for 97.6 percent of original list price, foreclosures sold in 83 days for 98.3 percent of original list price and short sales lagged at 166 days and 93.8 percent of original list price.

Weekly Market Report

Nationwide, local markets have become stable enough to withstand mortgage rate increases. Improving job and other economic sectors have fortified real, organic housing growth. Bargain-basement deals have given way to multiple offers, stiff bidding wars and lickety-split days on market. Inventory may still be thin, but traditional home sellers are stepping up to the plate with new listings. It won’t be long now until the housing recovery is once again referred to as just housing.

In the Twin Cities region, for the week ending July 20:

  • New Listings increased 25.1% to 1,731
  • Pending Sales increased 6.2% to 1,171
  • Inventory decreased 14.3% to 15,623

For the month of June:

  • Median Sales Price increased 17.5% to $210,000
  • Days on Market decreased 34.5% to 74
  • Percent of Original List Price Received increased 2.5% to 97.5%
  • Months Supply of Inventory decreased 25.0% to 3.6

Click here for the full Weekly Market Activity Report.From The Skinny.

Weekly Market Report

Housing isn’t just housing. That may have a strange ring to it. But housing includes building, inspecting, remodeling, lending, refinancing, furnishing and a host of other functions tied to the physical space of home. Each of these functions is tied to job growth and interest rates, and each has seen some spectacular highs and lows over the past eight years. There has been a recent sense of stability brewing in all of housing. Here’s to making the most of it.

In the Twin Cities region, for the week ending July 13:

  • New Listings increased 25.1% to 1,921
  • Pending Sales increased 26.5% to 1,352
  • Inventory decreased 15.6% to 15,390

For the month of June:

  • Median Sales Price increased 17.5% to $210,000
  • Days on Market decreased 34.5% to 74
  • Percent of Original List Price Received increased 2.5% to 97.5%
  • Months Supply of Inventory decreased 25.0% to 3.6

Click here for the full Weekly Market Activity Report.From The Skinny.

Median Price Exceeds $200,000 – Highest Since 2007

6a00e54ee9620b88340191042e2072970c-800wi

In light of a 14.2 percent increase in pending sales, Twin Cities home buyers seem unphased by recent mortgage rate increases. Even with rates around 4.5 percent, the housing stock remains highly affordable by historical comparison. In 25 of the past 26 months, there have been year-over-year gains in pending sales; and the metric is currently at its highest level since June 2006. House hunters are watching seller activity for clues of additional inventory.New listings rose 20.0 percent, the second-largest gain since March 2010. Buyers have 15,193 properties from which to choose – 17.2 percent fewer than in June 2012 but 17.4 percent more than in January 2013.

The median sales price for the metro area rose 17.5 percent to $210,000. That’s the highest median sales price since December 2007. A shift in sales types is driving this price recovery. As recently as February 2011, foreclosures and short sales comprised 61.5 percent of all sales activity.

In June 2013, these two distressed segments together comprised just 21.7 percent of all sales. On the seller side, the percentage of all new listings that were distressed in June fell to 16.8 percent, its lowest level since September 2007.

Seller activity was up 20.0 percent overall, but traditional new listings surged 44.4 percent. Foreclosure new listings decreased 24.6 percent and short sale new listings fell 51.7 percent. With 16 straight months of year-over-year price gains, multiple-offer situations and just 3.5 months’ supply of inventory, the same market that recently favored buyers is now tilting toward sellers.

Looking at price movement by segment, the traditional median sales price rose 8.7 percent to $232,000; the foreclosure median sales price was up 16.9 percent to $145,000; the short sale median sales price increased 14.2 percent, also to $145,000.

On average, traditional homes sold in 68 days for 97.7 percent of original list price, foreclosures sold in 71 days for 98.2 percent of original list price and short sales lagged at 156 days and 93.0 percent of original list price.

Weekly Market Report

A fellow named Newton once said that a body in motion tends to stay in motion. Presently, the housing market is going to be in a state of anti-motion, otherwise known as inertia. Each year, the activity around Independence Day collides with market trends because the summer holiday season ends up being more about family fun than housing fuss. As the market shifts from under us, things like historically low interest rates and rising rents cause pause for those with a clear idea of what they want despite the lack of funding to achieve it.

In the Twin Cities region, for the week ending June 29:

  • New Listings increased 22.8% to 1,738
  • Pending Sales increased 22.4% to 1,405
  • Inventory decreased 16.8% to 15,405

For the month of June:

  • Median Sales Price increased 17.5% to $210,000
  • Days on Market decreased 33.6% to 75
  • Percent of Original List Price Received increased 2.5% to 97.5%
  • Months Supply of Inventory decreased 27.1% to 3.5

Click here for the full Weekly Market Activity Report.From The Skinny.

Weekly Market Report

Consumer confidence, prices, sales and percent of list price received at sale are all generally on the ups. This has been a nice place to be for real estate practitioners. In terms of expecting the unexpected trends, economists suggest tuning into indicators such as jobs, stocks and Federal Reserve policy decisions. The keen industry professional deserves the most up-to-date stats for daily decision making. Read on for this week’s deserved sneak peek.

In the Twin Cities region, for the week ending June 22:

  • New Listings increased 28.9% to 1,797
  • Pending Sales increased 14.1% to 1,214
  • Inventory decreased 18.2% to 15,195

For the month of May:

  • Median Sales Price increased 14.8% to $194,000
  • Days on Market decreased 29.8% to 87
  • Percent of Original List Price Received increased 2.5% to 97.0%
  • Months Supply of Inventory decreased 30.6% to 3.4

Click here for the full Weekly Market Activity Report.From The Skinny.

Weekly Market Report

Sellers are finally starting to catch up with strong buyer demand, but at the rate that homes are being snatched up, the influx of new listings will need to be more than a short-term addition. Rising home prices, fewer days on market and more homes being sold all support a positive public opinion about real estate. The following local stats should shed invaluable quantitative support for that warm fuzzy feeling residential real estate is handing out.

In the Twin Cities region, for the week ending June 8:

  • New Listings increased 23.2% to 1,951
  • Pending Sales increased 12.0% to 1,329
  • Inventory decreased 21.7% to 14,569

For the month of May:

  • Median Sales Price increased 14.8% to $194,000
  • Days on Market decreased 29.8% to 87
  • Percent of Original List Price Received increased 2.5% to 97.0%
  • Months Supply of Inventory decreased 30.6% to 3.4

Click here for the full Weekly Market Activity Report.From The Skinny.

Pending Sales Levels Highest Since June 2005

Minneapolis, Minnesota (June 12, 2013) – May was an impressive month for the 13-county Twin Cities residential real estate market. With 5,872 pending sales, buyer demand continued its ascent, surging 18.5 percent to its highest level since June 2005. Seller activity was also up, as new listings rose 26.2 percent to 8,332 units, representing the largest gain in new listings since January 2006 and the highest number since April 2010. Buyers have 14,375 properties to choose from – 22.3 percent fewer than in May 2012 but 11.6 percent more than in January 2013.

The median sales price for the metro area rose 15.1 percent to $194,450. That’s the highest median sales price since August 2008. A shift in product type is driving this improvement. As recently as February 2011, foreclosures and short sales occupied 61.5% of all sales activity. In May 2013, these two distressed segments together comprised just 26.9 percent of all sales. The percentage of all new listings that were distressed in May 2013 fell to 18.6 percent, its lowest level since September 2007.

“With the recent disparity between massive buyer demand and sluggish seller supply, it is encouraging to see a substantial increase in traditional listings,” said Andy Fazendin, President of the Minneapolis Area Association of REALTORS® (MAAR).

Although new listings were up 26.2 percent overall, traditional new listings were up 49.9 percent, while foreclosure new listings were down 15.4 percent and short sale new listings were down 43.4 percent. With 15 straight months of year-over-year price gains, multiple-offer situations and just 3.4 months’ supply of inventory, the market landscape that once favored buyers has tilted toward sellers.

The traditional median sales price was up 7.3 percent to $220,000; the foreclosure median sales price was up 18.7 percent to $137,700; the short sale median sales price was up 4.4 percent to $141,000. On average, traditional homes sold in 78 days, foreclosures sold in 87 days and short sales lagged at 174 days.

“This is still about product mix. We once filled our grocery bag with ramen noodles,” said Emily Green, MAAR President-Elect. “Today we’re buying organic, grass-fed sirloin steaks. Grocery prices haven’t increased much, but
the value of what we’re buying has. Traditional homes tend to be of a higher quality and better maintained than foreclosures or short sales.”