
For 2020, the National Association of REALTORS’ Chief Economist, Lawrence Yun, sees good news for home prices.
Favorable rates and weather spur home buying in Twin Cities
February 22, 2020
Latest housing report also shows falling inventory and rising prices
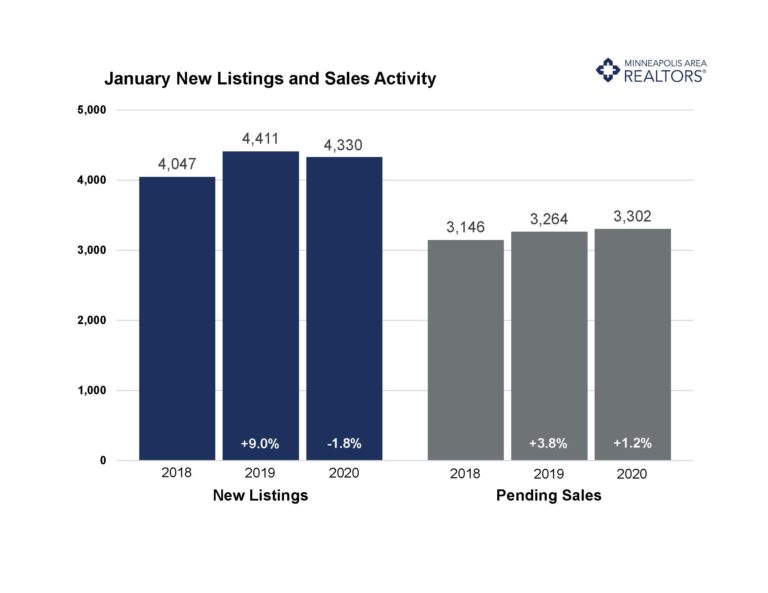
According to the latest housing report from the Minneapolis Area REALTORS® and the Saint Paul Association of REALTORS®, Twin Cities residential real estate started 2020 on solid but still uneven footing. Buyers were eager to ignite the spring market early, spurred by incredibly low mortgage rates and favorable weather, especially compared to last year. Tempering the market are falling inventory and rising prices.
“Buyers were again spoiled by rates that no one expected would be this low,” said Linda Rogers, President of Minneapolis Area REALTORS®. “That’s fueled more sales activity but we’re still missing the inventory piece.”
Sellers listed fewer homes for sale while buyers signed more purchase agreements and closed more deals. As a result, the number of homes for sale was almost 15 percent lower than last January. The supply squeeze wasn’t felt evenly across price points, though. While inventory of homes priced below $250,000 fell, the number of listings priced between $250,000 and $500,000 as well as $500,000 to $1,000,000 increased last month.
“The year is off to a solid start and metro area communities each have a unique story to tell when it comes to housing availability and price,” said Patrick Ruble, President of St. Paul Area Association of REALTORS®.
Some of the most competitive markets experiencing strong price growth are those with relatively higher levels of affordable or entry-level homes, such as Fridley, Vadnais Heights, Richfield, Brooklyn Center and Bloomington. That’s where multiple offers and homes selling for over list price are more common. Both millennial first-time buyers and downsizing empty nesters are competing over this limited supply of affordable homes close to the core cities. The move-up and upper-bracket home price segments are more balanced and better supplied.
January 2020 by the numbers (compared to a year ago)
- Sellers listed 4,330 properties on the market, a 1.8 percent decrease from last January
- Buyers closed on 2,870 homes, a 5.4 percent increase
- Inventory levels declined 14.9 percent to 7,595 units
- Months Supply of Inventory was down 16.7 percent to 5 months (5-6 months is balanced)
- The Median Sales Price rose 4.2 percent to $270,000
- Cumulative Days on Market increased 1.5 percent to 66 days, on average (median of 43)
- Changes in Sales activity varied by market segment
- Single family sales rose 5.5 percent; condo sales fell 3.5 percent; townhome sales rose 11.7 percent
- Traditional sales increased 7.1 percent; foreclosure sales dropped 26.0 percent; short sales fell 52.6 percent
- Previously owned sales were up 5.5 percent; new construction sales climbed 11.1 percent
Weekly Market Report

For Week Ending February 8, 2020
The impact of the spread of Coronavirus continues to grow as the 30-year fixed-rate mortgage fell to 3.51% last week. Lawrence Yun, chief economist at the National Association of REALTORS®, explained that the upper-end of the housing market may soften with the temporary loss of Chinese buyers. “China has been the most important source of foreign demand for real estate,” he explained. Until temporary travel bans are lifted, many potential Chinese buyers will be restricted from visiting the U.S., which will in turn reduce the number of active home buyers, particularly at the high end of the market.
In the Twin Cities region, for the week ending February 8:
- New Listings increased 14.1% to 1,315
- Pending Sales increased 18.4% to 960
- Inventory decreased 15.6% to 7,556
For the month of January:
- Median Sales Price increased 4.2% to $270,000
- Days on Market increased 1.5% to 66
- Percent of Original List Price Received decreased 0.1% to 97.0%
- Months Supply of Homes For Sale decreased 16.7% to 1.5
All comparisons are to 2019
Click here for the full Weekly Market Activity Report. From MAAR Market Data News.
December Monthly Skinny Video
“Buyer demand continues to be strong, especially given the supply constraints.”
Weekly Market Report
For Week Ending February 1, 2020
A newly released report from the U.S. Census Bureau shows in Q4 2019 the national homeownership rate rose to 65.1%. This is the highest level since Q3 2013 when the homeownership rate was 65.3%. For perspective, the national homeownership rate since 2000 peaked at 69.1% in Q1 2005 and was at its lowest at 62.9% in Q2 2016. The increase in the homeownership rate since Q2 2016 represents nearly 2.7 million additional owner-occupied homes.
In the Twin Cities region, for the week ending February 1:
- New Listings increased 4.5% to 978
- Pending Sales increased 6.1% to 904
- Inventory decreased 15.5% to 7,621
For the month of December:
- Median Sales Price increased 7.9% to $278,200
- Days on Market decreased 1.8% to 56
- Percent of Original List Price Received increased 0.5% to 97.3%
- Months Supply of Homes For Sale decreased 15.8% to 1.6
All comparisons are to 2019
Click here for the full Weekly Market Activity Report. From MAAR Market Data News.
Despite tight market Twin Cities real estate activity up in 2019
February 6, 2020
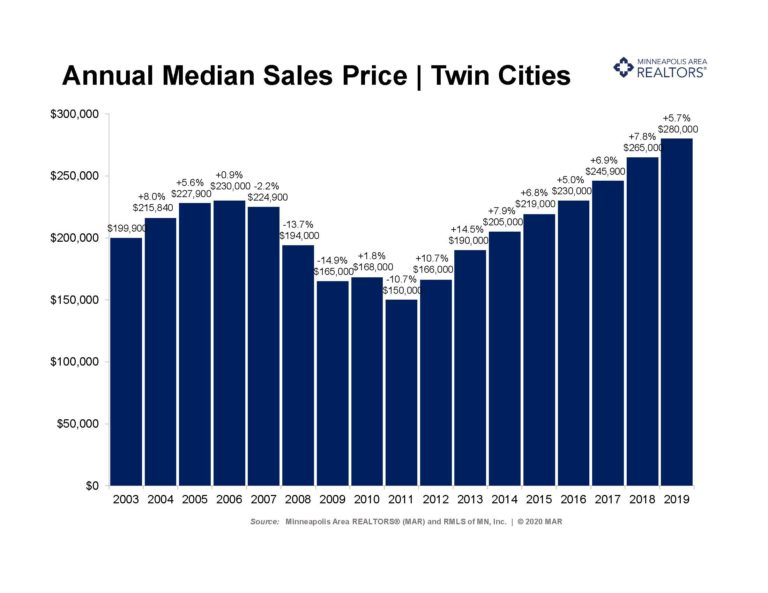
The Twin Cities housing market continued to show steady growth in 2019 according to the annual market wrap-up from the Minneapolis Area REALTORS® and the St. Paul Area Association of REALTORS®. At a joint news conference in St. Paul, the associations announced a growing economy, favorable rates and a persistent scarcity of homes for sale have uplifted home prices for eight consecutive years. Lower mortgage rates helped offset declining affordability brought on by rising home prices.
“In our market, like others across the country, lack of housing inventory has been a recurring theme for buyers. It continued in 2019 as buyers, looking for entry level options and more affordable choices, felt the most pressure. Buyers, however, have remained persistent resulting in gains, both in sales volume and price appreciation,” said Patrick Ruble, President of the Saint Paul Area Association of REALTORS®. “Fortunately, the region’s economy continues to grow, unemployment remains low and we are seeing growth in wages. We have a healthy market and look forward to some of the sticking points, such as the limited inventory, easing in the coming year.”
Sellers reversed three years of declines with a modest 0.2 percent increase in new listings in 2019. Buyers overturned a sales decline in 2018 with a 0.8 percent increase in purchases. The ongoing housing shortage has led to a competitive environment where multiple offers are commonplace, frustrating some consumers. Therefore, sellers are receiving strong offers in near record time. Market times did, however, increase 2.1 percent from 2018 while the ratio of sold to list price declined 0.1 percent. These two metrics could be early indicators of a shifting balance.
“Overall 2019 was a good year for real estate. After a slow start, activity picked up once rates fell back below 4.0 percent mid-year,” said Linda Rogers, President of the Minneapolis Area REALTORS®. “The second half of the year saw consistent sales gains, as record prices and declining affordability were offset by favorable rates and wage growth. Buyers were persistent despite tight inventory—particularly under $300,000. That’s no surprise, as the Twin Cities are a wonderful place to live, work and play.”
Rates remained attractive during the year. Despite starting the year around 4.5 percent, mortgage rates fell to 3.7 by year-end. Single family and new construction sales led the pack; so it’s no surprise that four-bedroom homes and homes over 2,500 square feet saw the largest gains. There’s still a “tale of two markets” dynamic at play: the under $350,000 or first-time buyer segment is severely undersupplied but also in high demand. The move-up market for homes over $500,000 is much better supplied, giving buyers more options and negotiating room.
“The Twin Cities housing market is a reflection of what’s been happening statewide,” said Bob Clark, President of the Minnesota Association of REALTORS®. “Realtors across Minnesota finished the year with slight increases in closings, new listings and continued growth in home prices.”
2019 by the Numbers
Sellers listed 76,345 properties on the market, a 0.2 percent increase from 2018
Buyers closed on 59,843 homes, a 0.8 percent increase from 2018
Inventory levels for December fell 19.6 percent compared to 2018 to 7,431 units
Months Supply of Inventory was down 21.2 percent o 1.5 months
The Median Sales Price rose 5.7 percent to $280,000, a record high
Cumulative Days on Market increased 2.1 percent to 49 days, on average (median of 23)
Changes in sales activity varied by market segment
Single-family sales increased 1.5 percent; condo sales fell 1.7 percent; townhome sales were down 1.4 percent
Traditional sales rose 1.8 percent; foreclosure sales decreased 31.9 percent; short sales fell 35.2 percent
Previously-owned sales increased 0.3 percent; new construction sales rose 6.9 percent
For other year-end residential real estate information and for stand-alone December 2019 data, visit www.mplsrealtor.com.
Weekly Market Report
For Week Ending January 25, 2020
CoreLogic’s latest Single-Family Rent Index report saw the cost of renting single-family homes, including condos, up 3% in November 2019 compared to November 2018. According to the report, rent prices started climbing in 2010 and have stabilized around an annualized rate of 3% since early 2019. With the cost of rent continuing to trend upward, it makes sense that many are considering paying their own mortgage, instead of their landlord’s, by becoming first-time homeowners.
In the Twin Cities region, for the week ending January 25:
- New Listings decreased 5.2% to 916
- Pending Sales decreased 0.9% to 795
- Inventory decreased 14.9% to 7,751
For the month of December:
- Median Sales Price increased 8.2% to $279,000
- Days on Market decreased 1.8% to 56
- Percent of Original List Price Received increased 0.5% to 97.3%
- Months Supply of Homes For Sale decreased 15.8% to 1.6
All comparisons are to 2019
Click here for the full Weekly Market Activity Report. From MAAR Market Data News.
Weekly Market Report
For Week Ending January 18, 2020
The Mortgage Bankers Association reported that applications for home purchases rose 16% last week, reaching its highest level since 2009. Applications to refinance also grew, increasing a stunning 43% last week and are 109% higher than a year ago, the MBA reports. The sharp increases in both purchase and refinance applications are spurred by lower rates providing incentives for both buyers and existing homeowners to act.
In the Twin Cities region, for the week ending January 18:
- New Listings decreased 14.3% to 904
- Pending Sales increased 2.5% to 734
- Inventory decreased 14.3% to 7,770
For the month of December:
- Median Sales Price increased 8.2% to $279,000
- Days on Market decreased 1.8% to 56
- Percent of Original List Price Received increased 0.5% to 97.3%
- Months Supply of Homes For Sale decreased 21.1% to 1.5
All comparisons are to 2019
Click here for the full Weekly Market Activity Report. From MAAR Market Data News.
Weekly Market Report
For Week Ending January 11, 2020
Freddie Mac reported that the average 30-year fixed-rate mortgage dropped to 3.64% this week, the lowest level in three months and down from 4.45% one year ago. Additionally, conforming and FHA loan limits have increased for 2020. Increased loan limits coupled with low rates, will give more buyers the ability to purchase a wider range of properties. These changes, along with the continued strong labor market, is likely to spur buyer demand even in the face of a constrained supply of homes for sale throughout much of the country.
In the Twin Cities region, for the week ending January 11:
- New Listings decreased 4.9% to 998
- Pending Sales decreased 12.2% to 592
- Inventory decreased 15.2% to 7,624
For the month of December:
- Median Sales Price increased 8.0% to $278,600
- Days on Market decreased 1.8% to 56
- Percent of Original List Price Received increased 0.4% to 97.2%
- Months Supply of Homes For Sale decreased 21.1% to 1.5
All comparisons are to 2019
Click here for the full Weekly Market Activity Report. From MAAR Market Data News.
Weekly Market Report
For Week Ending January 4, 2020
With the start of the New Year, the real estate market turns more active across mostof the country. Sellers connect with agents, resulting in a pop of new listings, followed by renewed interest by buyers, which leads to an increase in pending sales. This pattern is seen every year and 2020 should be no different. We’re starting off the year with continued low interest rates, low unemployment, and rising rents nationally. This sets us up for a strong start to 2020 and plenty of optimism for the coming spring market.
In the Twin Cities region, for the week ending January 4:
- New Listings decreased 17.9% to 683
- Pending Sales decreased 7.0% to 546
- Inventory decreased 12.8% to 8,064
For the month of November:
- Median Sales Price increased 5.6% to $279,900
- Days on Market decreased 1.9% to 51
- Percent of Original List Price Received increased 0.2% to 97.5%
- Months Supply of Homes For Sale decreased 4.5% to 2.1
All comparisons are to 2019
Click here for the full Weekly Market Activity Report. From MAAR Market Data News.