

For Week Ending April 4, 2020
More than 6.6 million workers filed for unemployment benefits last week according to the latest report by the Labor Department, on top of the 3.3 million that filed for unemployment the week prior. High levels of unemployment filings are expected to continue in the coming weeks as businesses remain shuttered and shelter in place orders have expanded to cover most of the country. The impact of these orders is becoming more apparent in the market activity stats reported here.
In the Twin Cities region, for the week ending April 4:
- New Listings decreased 27.7% to 1,393
- Pending Sales decreased 13.7% to 1,077
- Inventory decreased 7.9% to 8,859
For the month of February:
- Median Sales Price increased 6.2% to $281,570
- Days on Market decreased 2.9% to 67
- Percent of Original List Price Received increased 0.3% to 98.0%
- Months Supply of Homes For Sale decreased 5.6% to 1.7
All comparisons are to 2019
Click here for the full Weekly Market Activity Report. From MAAR Market Data News.
Weekly Market Report
For Week Ending March 28, 2020
This week was heavily influenced by the ongoing impacts from the spread of COVID-19. Washington passed a $2.2 trillion stimulus package and news broke that 3.28 million people filed for unemployment benefits last week—nearly five times the previous weekly record. As more businesses temporarily close due to the growing outbreak, even higher unemployment filings are expected in coming weeks. As many begin or continue to shelter at home, real estate activity is slowing down right along with the rest of the economy.
In the Twin Cities region, for the week ending March 28:
- New Listings decreased 5.8% to 1,422
- Pending Sales decreased 5.4% to 1,131
- Inventory decreased 7.0% to 8,843
For the month of February:
- Median Sales Price increased 6.2% to $281,570
- Days on Market decreased 2.9% to 67
- Percent of Original List Price Received increased 0.3% to 98.0%
- Months Supply of Homes For Sale decreased 11.1% to 1.6
All comparisons are to 2019
Click here for the full Weekly Market Activity Report. From MAAR Market Data News.
Weekly Market Report
For Week Ending March 21, 2020
This week Fannie Mae, Freddie Mac, and the FHA suspended all foreclosures and evictions for 60 days in response to the continued COVID-19 outbreak. Further, the Federal Housing Finance Agency (FHFA) annouced that borrowers with loans backed by Fannie Mae and Freddie Mac who face financial difficulties due to COVID-19 may be able to suspend their mortage payments for up to 12 months. Impacted borrowers are urged to reach out to their mortgage companies to discuss their situation.
In the Twin Cities region, for the week ending March 21:
- New Listings increased 16.0% to 1,688
- Pending Sales increased 11.0% to 1,183
- Inventory decreased 7.1% to 8,653
For the month of February:
- Median Sales Price increased 6.2% to $281,500
- Days on Market decreased 2.9% to 67
- Percent of Original List Price Received increased 0.3% to 98.0%
- Months Supply of Homes For Sale decreased 11.1% to 1.6
All comparisons are to 2019
Click here for the full Weekly Market Activity Report. From MAAR Market Data News.
Weekly Market Report
For Week Ending March 14, 2020
After hitting a record low last week, rates on 30-year fixed-rate mortgages rose slightly this week according to Freddie Mac. A combination of an increase in rates in the bond market and high demand for refinancing and purchase mortgages contributed to the uptick. Meanwhile, the continued spread of COVID-19 is leading many companies and consumers to change their daily activities. ShowingTime is closely monitoring the situation and releasing daily updates on changes in showing activity: https://www.showingtime.com/impact-of-coronavirus/
In the Twin Cities region, for the week ending March 14:
- New Listings increased 21.7% to 1,713
- Pending Sales increased 16.0% to 1,205
- Inventory decreased 8.7% to 8,364
For the month of February:
- Median Sales Price increased 6.2% to $281,570
- Days on Market decreased 2.9% to 67
- Percent of Original List Price Received increased 0.3% to 98.0%
- Months Supply of Homes For Sale decreased 11.1% to 1.6
All comparisons are to 2019
Click here for the full Weekly Market Activity Report. From MAAR Market Data News.
Showings decline in Twin Cities amid coronavirus concerns
(March 19, 2020) – According to new data from the Saint Paul Area Association of REALTORS® and the Minneapolis Area REALTORS®, the number of Twin Cities residential real estate showings declined in most price ranges during the week ending March 17 compared to the previous week. The declines, which come amid the coronavirus pandemic, were most prominent in the higher price brackets.
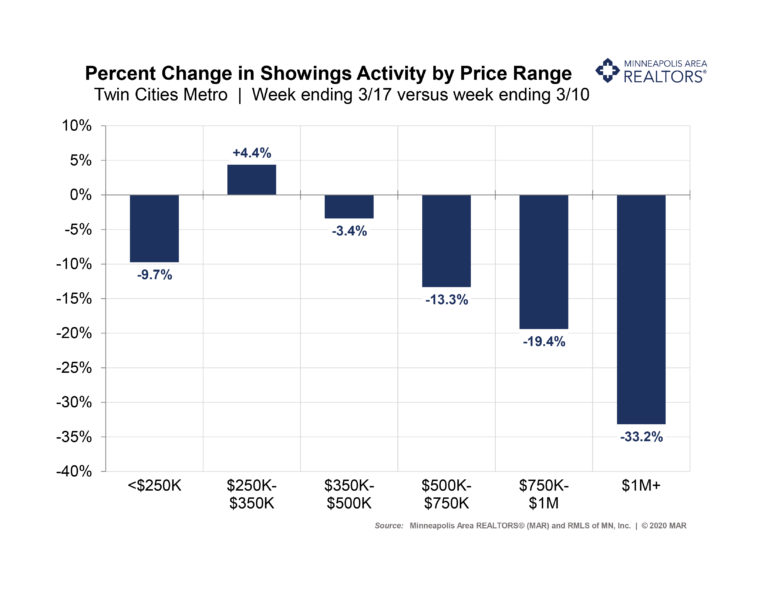
Showings decreased by 9.7% in the under $250,000 price bracket, where inventory is down significantly. The in-demand $250,000 to $350,000 price range was the only one that had an increase in showings. Homes priced over $1million saw a 33.2% decline in showings.
“It appears that concerns about spreading the coronavirus are starting to have an impact on our market,” said Patrick Ruble, President of the Saint Paul Area Association of REALTORS®. “REALTORS® are encouraged to follow the most current best practices in accordance with their brokers, which should be following the CDC guidelines. This includes activities such as open houses, active listings and interactions with clients and visitors.”
New listings, which are usually on the rise this time of year, have been weakening over the past couple of weeks. Active listings, or the total number of homes for sale, have also started softening in recent days. On a positive note pending sales, or the number of signed purchase agreements, remained strong during this period.
“Buyers in the more affordable price ranges embraced the low rates and mild weather,” said Linda Rogers, President of Minneapolis Area REALTORS®. “We are noticing fewer showings in the higher price points, reflecting both buyer and seller concerns and time will tell how the rest of the month plays out.”
In other news, the February numbers showed buyer and seller activity were up compared to last year. But the gains appear deceptively large due to weather challenges that held activity back in February 2019. Even so, the gains—particularly for pending sales—also outpaced 2018 levels.
Seller listing activity effectively recovered after the snow and melt we saw in 2019 and then increased slightly over 2018 levels. The nearly 24.0 percent increase in pending sales—or the number of signed purchase agreements—goes beyond weather. Mortgage rates have fallen throughout the year and spent most of February below 3.5 percent, compared to around 4.5 percent in February 2019. The Federal Reserve recently acted to further lower interest rates to limit the downside risks of COVID-19 to the economy. Home sales help the economy and low rates help to hedge against declining affordability brought on by rising prices.
February 2020 by the numbers compared to a year ago

- Sellers listed 5,293 properties on the market, a 19.9 percent increase from last February
- Buyers signed 4,267 purchase agreements, up 23.9 percent (3,016 closed sales, up 6.0 percent)
- Inventory levels declined 12.4 percent to 7,879 units
- Months Supply of Inventory was down 11.1 percent to 1.6 months (5-6 months is balanced)
- The Median Sales Price rose 6.3 percent to $282,000
- Cumulative Days on Market decreased 2.9 percent to 67 days, on average (median of 40)
- Changes in Sales activity varied by market segment
-
- Single family sales rose 4.9 percent;condo sales fell 1.4 percent; townhome sales rose 17.7 percent
- Traditional sales increased 6.9 percent; foreclosure sales rose 8.5 percent; short sales fell 5.9 percent
- Previously owned sales were up 6.3 percent; new construction sales climbed 16.8 percent
For more information on weekly and monthly housing numbers visit www.mplsrealtor.com.
From The Skinny Blog.
February Monthly Skinny Video
As the stock market declined, so did mortgage rates offering a bad new-good news situation.
Weekly Market Report
For Week Ending March 7, 2020
A report released this week from property management software firm RealPage predicts a total of 371,000 new apartments to enter the market in 2020, which would be the highest level across the country’s 150 largest apartment markets in three decades. Nationwide there is still a significant housing shortage and so increases in any housing type can help reduce pressure throughout the market.
In the Twin Cities region, for the week ending March 7:
- New Listings increased 31.1% to 1,755
- Pending Sales increased 23.2% to 1,162
- Inventory decreased 11.0% to 8,001
For the month of February:
- Median Sales Price increased 6.2% to $281,500
- Days on Market decreased 2.9% to 67
- Percent of Original List Price Received increased 0.3% to 98.0%
- Months Supply of Homes For Sale decreased 11.1% to 1.6
All comparisons are to 2019
Click here for the full Weekly Market Activity Report. From MAAR Market Data News.
Weekly Market Report
For Week Ending February 29, 2020
The U.S. Commerce Department reported this week that new-home sales rose 7.9% in January to a seasonally adjusted annual rate of 764,000 units, which is 18.6% higher than a year ago and the highest monthly sales pace since July 2007. While new-home sales are increasing, new-home inventories fell 6.6% from a year ago and are now the lowest since 2017. The National Association of REALTORS® and others are calling on home builders to increase residential home construction to meet increased demand, but a labor shortage, higher costs of construction and possible supply-chain disruption due to COVID-19 may limit homebuiders’ ability to respond to the increased demand.
In the Twin Cities region, for the week ending February 29:
- New Listings increased 8.0% to 1,395
- Pending Sales increased 12.2% to 1,083
- Inventory decreased 13.1% to 7,785
For the month of January:
- Median Sales Price increased 4.2% to $270,000
- Days on Market increased 3.1% to 67
- Percent of Original List Price Received decreased 0.1% to 97.0%
- Months Supply of Homes For Sale decreased 11.1% to 1.6
All comparisons are to 2019
Click here for the full Weekly Market Activity Report. From MAAR Market Data News.
Weekly Market Report
For Week Ending February 22, 2020
The ShowingTime Showing Index® for January saw a 20.2 percent year-over-year increase in showing traffic nationwide. All regions of the country were up double-digits from the year before, with the Midwest Region up 15.7 percent and the West Region, up 34.1 percent. As showing activty is a leading indicator for future home sales, the 2020 housing market is off to a strong start.
In the Twin Cities region, for the week ending February 22:
- New Listings increased 31.4% to 1,269
- Pending Sales increased 20.8% to 1,073
- Inventory decreased 14.4% to 7,734
For the month of January:
- Median Sales Price increased 4.2% to $270,000
- Days on Market increased 3.1% to 67
- Percent of Original List Price Received decreased 0.1% to 97.0%
- Months Supply of Homes For Sale decreased 11.1% to 1.6
All comparisons are to 2019
Click here for the full Weekly Market Activity Report. From MAAR Market Data News.
Weekly Market Report
For Week Ending February 15, 2020
According to the latest REALTORS® Confidence Index Survey of more than 8,000 real estate respondents, one in four home sales faced a settlement delay in December 2019. Seventy-one percent closed on time and four percent were canceled altogether. The biggest reasons cited for a delayed closing were issues related to financing (37%), appraisal issues (19%), and home inspection/environmental issues (17%).
In the Twin Cities region, for the week ending February 15:
- New Listings increased 9.6% to 1,156
- Pending Sales increased 13.9% to 967
- Inventory decreased 14.8% to 7,692
For the month of January:
- Median Sales Price increased 4.2% to $270,000
- Days on Market increased 3.1% to 67
- Percent of Original List Price Received decreased 0.1% to 97.0%
- Months Supply of Homes For Sale decreased 11.1% to 1.6
All comparisons are to 2019
Click here for the full Weekly Market Activity Report. From MAAR Market Data News.