Mixed Spring: Activity cools while prices, market times remain hot

By David Arbit on Wednesday, April 18th, 2018

From colder-than-average temperatures to a record-breaking snow storm, this spring has been anything but normal. While those searching for homes have seen more options since January or February, they’re still seeing fewer options compared to last year. That’s capped sales activity—particularly at the entry-level prices—and the lack of inventory combined with rising prices is encouraging some sellers to hold onto their properties.

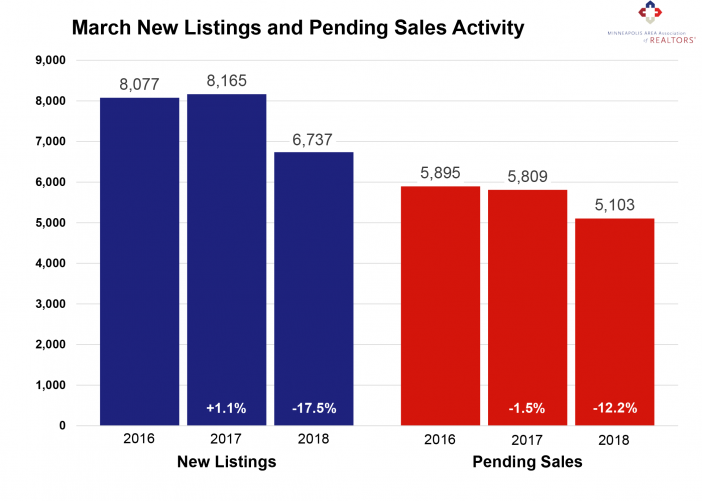
In March, sellers listed 17.5 percent fewer homes on the market—the fifth consecutive month of declines compared to a year ago. Largely due to the shortage, closed sales declined 10.3 percent compared to the year prior. For-sale housing inventory was 26.1 percent lower than March 2017, the largest decline in over a year. This shortage has created a competitive environment where multiple offers and homes selling for over list price have become more common.

Sellers are receiving strong offers close to their original list price quickly, which can sometimes frustrate home buyers. New construction closed sales rose 13.1 percent compared to last March. Although single family homes made up about 74.0 percent of all sales, townhomes have enjoyed more resilient demand lately. Similarly, previously-owned homes made up about 89.0 percent of sales but new construction showed a much stronger increase in pending and closed purchase activity.

“We’re seeing some early evidence that the seller’s market could be starting to shift toward a balanced market,” said Kath Hammerseng, President of the Minneapolis Area Association of REALTORS® (MAAR), “When it comes to the long-term health of the housing market, that’s very much a good thing.”

March 2018 by the Numbers (compared to a year ago)

  • Sellers listed 6,737 properties on the market, a 17.5 percent decrease
  • Buyers closed on 3,978 homes, a 10.3 percent decrease
  • Inventory levels for March fell 26.1 percent compared to 2017 to 8,289 units
  • Months Supply of Inventory was down 22.7 percent to 1.7 months
  • The Median Sales Price rose 9.8 percent to $258,000, a record high for March
  • Cumulative Days on Market declined 21.9 percent to 57 days, on average (median of 22)
  • Changes in Sales activity varied by market segment:
    • Single family sales fell 9.8 percent; condo sales declined 10.0 percent; townhome sales shrank 9.6 percent
    • Traditional sales fell 7.5 percent; foreclosure sales decreased 39.3 percent; short sales fell 47.3 percent
    • Previously-owned sales fell 11.4 percent; new construction sales rose 13.1 percent

    “Prices continue to rise while market times remain brisk,” said Todd Urbanski, President-Elect of MAAR. “This spring market is shaping to be more buyer-friendly than last year, it’s still a great time to get properties listed.”

    From The Skinny Blog.

Sales down in early spring market while prices rally

By David Arbit on Friday, March 16th, 2018

The big story of 2017 was threefold: the median sales price reached an all-time high; closed sales reached a 12-year high; and inventory levels reached a 15-year low. Sales nearly broke their all-time record, but fell just short of their all-time 2004 high. In February 2018, new listings posted a year-over-year decline for a fourth consecutive month. Mostly due to the supply shortage, closed sales were lower compared to the year prior for a third consecutive month. For-sale housing supply (inventory) was 23.0 percent lower than February 2017. This shortage has created a competitive environment where multiple offers have become commonplace. Sellers are receiving strong offers close to their original list price in record time, which can sometimes frustrate home buyers. New construction closed sales rose 15.7 percent compared to last February. Although single-family homes made up about 73.0 percent of all sales, condos and townhomes showed the strongest increase in closed sales. Similarly, previously-owned homes made up about 88.7 percent of sales but new construction showed a much stronger increase in pending and closed purchase activity.

February 2018 by the Numbers

  • Sellers listed 5,072 properties on the market, an 8.0 percent decrease from February 2017
  • Buyers closed on 2,635 homes, a 6.0 percent decrease from 2017
  • Inventory levels for February fell 23.0 percent compared to 2017 to 7,537 units, near a 15-year low
  • Months Supply of Inventory was down 21.1 percent to 1.5 months, also near a 15-year low
  • The Median Sales Price rose 12.7 percent to $250,000, a record high for February
  • Cumulative Days on Market declined 15.9 percent to 69 days, on average (median of 38)—a 12-year low
  • Changes in sales activity varied by market segment
    • Single-family sales fell 8.3 percent; condo sales rose 1.9 percent; townhome sales rose 6.3 percent
    • Traditional sales fell 1.3 percent; foreclosure sales fell 43.3 percent; short sales fell 39.6 percent
    • Previously-owned sales fell 6.3 percent; new construction sales rose 15.7 percent

From The Skinny Blog.
Sluggish start to 2018 after a record 2017

By David Arbit on Friday, February 16th, 2018

The big story of 2017 was threefold: the median sales price reached an all-time high; closed sales reached a 12-year high; and inventory levels reached a 15-year low. Sales nearly broke their all-time record, but fell just 12 units short of their all-time 2004 high. In January 2018, new listings posted a year-over-year decline for a third consecutive month. Because of the supply shortage, closed sales were lower compared to the year prior for a second consecutive month. For-sale housing supply (inventory) was about a quarter lower than January 2017. This shortage has created a competitive environment where multiple offers have become commonplace. Sellers are receiving strong offers close to their original list price in record time, which can sometimes frustrate home buyers. New construction pending sales rose nearly 14.0 percent compared to last January. Although single-family homes made up about 76.0 percent of all sales, townhomes were the only segment to show an increase in pending sales. Similarly, previously-owned homes made up about 91.0 percent of sales but new construction showed a much stronger increase in pending purchase activity.

January 2018 by the Numbers

• Sellers listed 4,041 properties on the market, a 7.8 percent decrease from January 2017
• Buyers closed on 2,758 homes, a 4.4 percent decrease from 2017
• Inventory levels for January fell 26.3 percent compared to 2017 to 6,875 units, near a 15-year low
• Months Supply of Inventory was down 27.8 percent to 1.3 months, a 15-year low
• The Median Sales Price rose 9.6 percent to $243,750, a record high for January
• Cumulative Days on Market declined 13.8 percent to 69 days, on average (median of 45)—a 12-year low
• Changes in sales activity varied by market segment

    o Single-family sales fell 1.3 percent; condo sales fell 15.1 percent; townhome sales fell 8.5 percent
    o Traditional sales fell 1.7 percent; foreclosure sales fell 21.8 percent; short sales fell 42.4 percent
    o Previously-owned sales fell 3.8 percent; new construction sales fell 0.4 percent

From The Skinny Blog.
Home Prices Reach Record High; Home Sales Reach 12-year High

By David Arbit on Wednesday, January 24th, 2018

2017 Annual Wrap-Up:
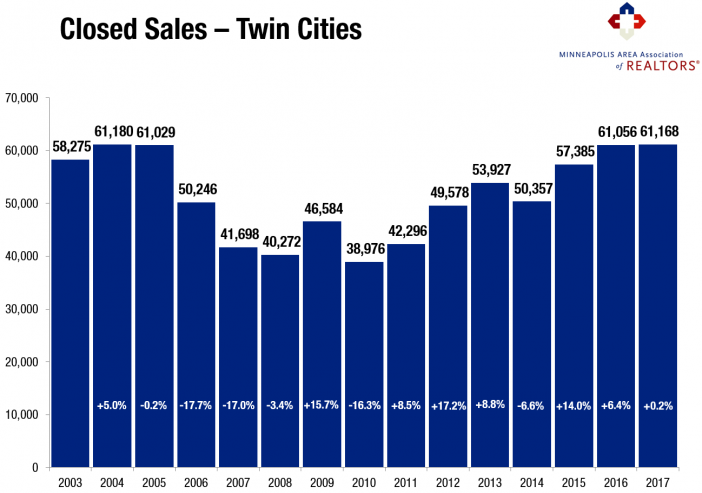
The big story of 2017 was threefold: the median sales price reached an all-time high; closed sales reached a 12-year high; and inventory levels reached a 15-year low. Sales nearly broke their all-time record, but fell just 12 units short of their all-time 2004 high. Seller activity declined slightly for a second year. Near-record sales activity combined with weaker seller activity exacerbated the supply shortage. For-sale housing supply fell to a 15-year low. This shortage has created a competitive environment where multiple offers have become more common. Sellers are receiving strong offers in record time, but this fast-paced market can frustrate some consumers. Days on market fell to an 11-year low. Absorption rates fell to 1.4 months of supply at year-end, also a 15-year record low. Foreclosure activity fell for a sixth straight year and is back below 2007 levels. Although single-family homes made up about 75.0 percent of all sales, both townhomes and condos showed a stronger increase in sales. Similarly, previously-owned homes made up about 93.0 percent of sales but new construction showed a much stronger increase.

2017 by the Numbers
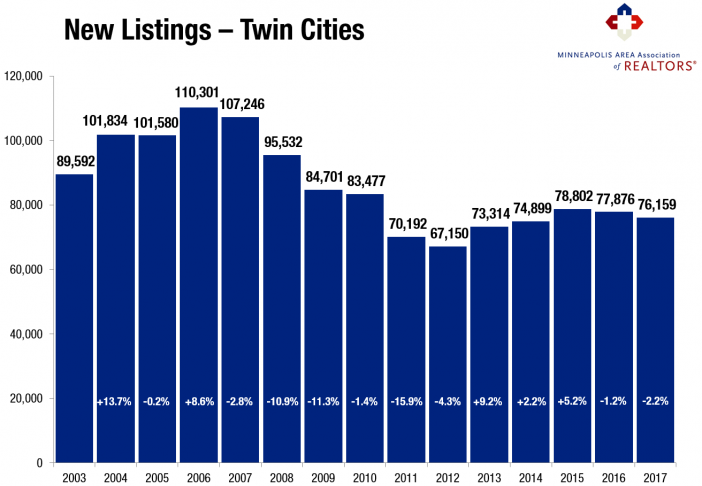
• Sellers listed 76,159 properties on the market, a 2.2 percent decrease from 2016
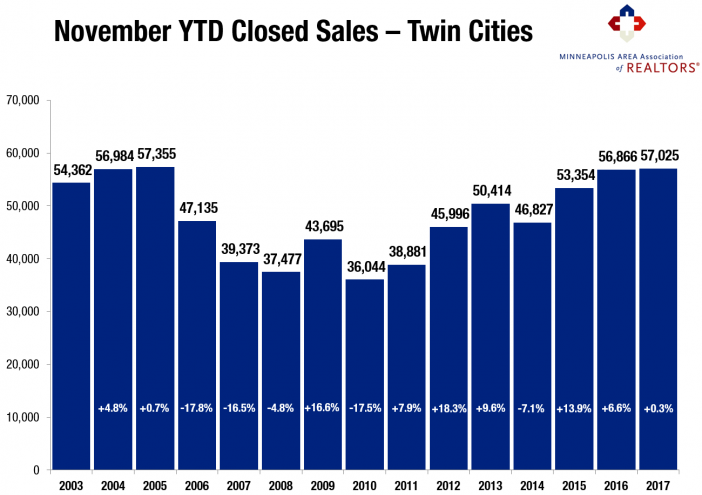
• Buyers closed on 61,168 homes, a 0.2 percent increase from 2016 and the highest figure since 2004
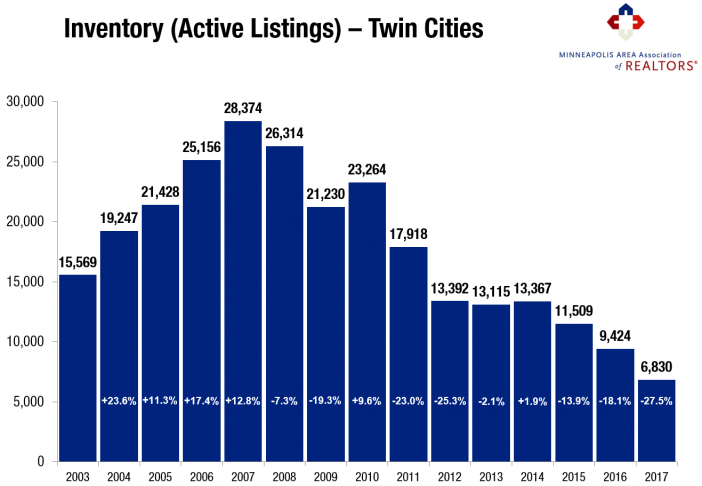
• Inventory levels for December fell 27.5 percent compared to 2016 to 6,830 units, a 15-year low
• Months Supply of Inventory was down 26.3 percent to 1.4 months, also a 15-year low
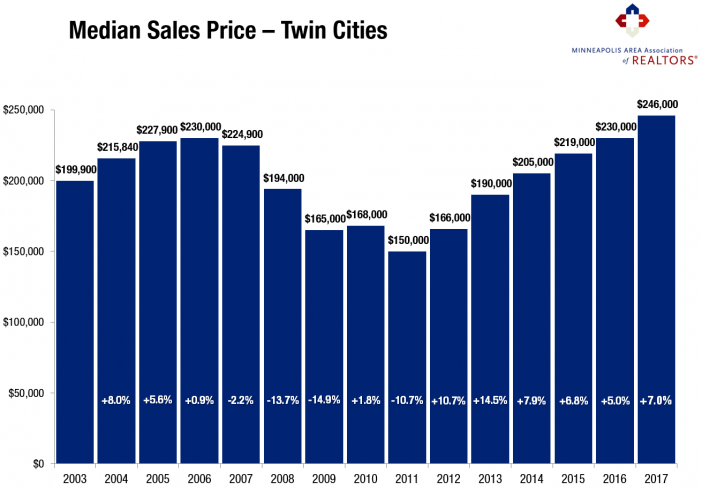
• The Median Sales Price rose 7.0 percent to $246,000, which is an all-time record high
• Cumulative Days on Market declined 13.8 percent to 56 days, on average (median of 27)—an 11-year record low
• Changes in sales activity varied dramatically by market segment:

Single-family sales decreased 1.1 percent; condo sales rose 2.0 percent; townhome sales rose 5.7 percent
Traditional sales rose 3.7 percent; foreclosure sales fell 42.8 percent; short sales fell 49.9 percent
Previously-owned sales declined 0.7 percent; new construction sales rose 13.9 percent

“It was an interesting year in a lot of ways. In addition to record prices and near-record sales, the inventory shortage and some affordability concerns also took center stage. Our region is extremely high-performing when it comes to homeownership, employment, education and quality of life. That said, as some market challenges get resolved, expect homeownership to remain an attractive opportunity moving forward,” said Kath Hammerseng, president of the Minneapolis Area Association of REALTORS®.

Sellers posted their second consecutive decrease in activity. New listings were down a slight 2.2% compared to 2016. Many sellers are still motivated by rising prices and quick market times, some sellers have decided to wait it out, enjoy the ride up and hope for more inventory choices before they list their home for sale.

Buyers were active in 2017. Closed sales reached a 13-year high and were within 12 sales of breaking their all-time record from 2004. Encouraged by low interest rates, rising rents and an improving economy, housing demand was exceptionally strong. These gains were driven by more activity in the higher price brackets, as well as increases in condo-townhomes and new construction.

With supply levels at 15-year lows and demand indicators at 12-year highs, the median sales price rose 7.0 percent to $246,000. This marks an all-time record high. Home prices have risen 64.0% from their low point in 2011. Rising prices boost equity, motivate reluctant sellers and replenish local tax base, but can also harm affordability if incomes don’t keep pace.

Inventory levels fell 27.5% to a 15-year low. Consumers had 6,830 options to choose from in December but over 13,400 in July. When combined with strong demand, this supply-side constraint has resulted in competitive bidding on some listings. This shortage has frustrated some buyers. Replenishing supply levels is critical to sustained market health as well as to maintaining a spectrum of housing opportunity for all buyers.

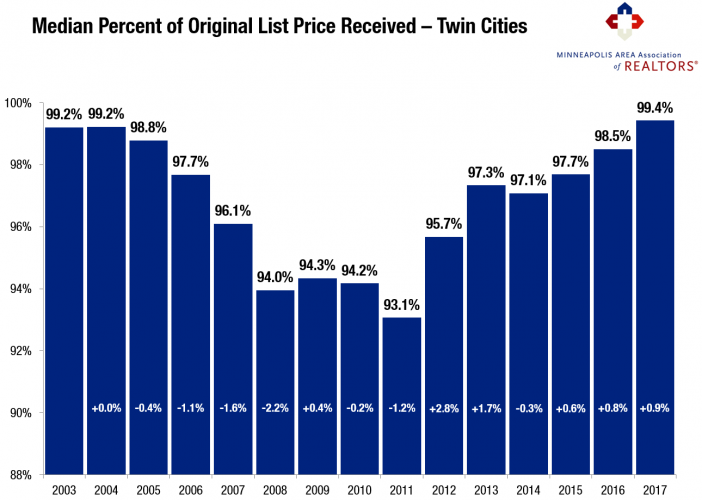
Mostly due to fundamentals but also better pricing decisions, sellers yielded a higher share of their asking price. The median percent of original list price received reached a record high of 99.4 percent. Sellers had a 50/50 chance of receiving more than their current list price. The landscape for sellers has improved immensely. Most sellers can expect to receive offers very close to their list price.

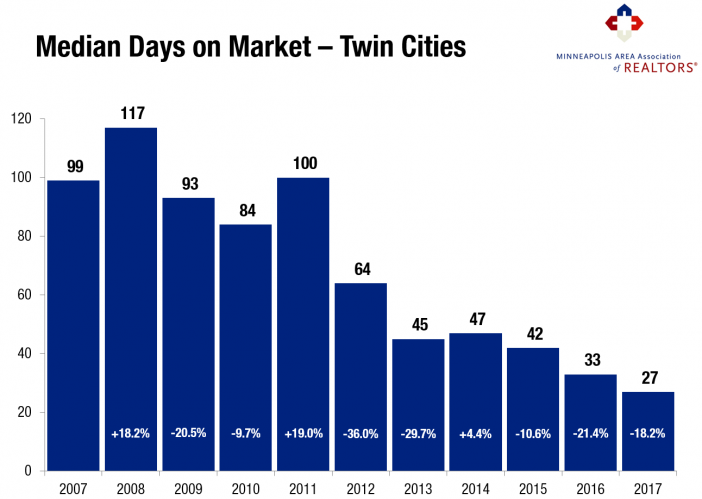
Homes are selling at an 11-year record pace. Listings spent a median of 27 days on the market, 18.3 percent fewer than in 2016. That is less than half the market time from 2012 and nearly a quarter of the market time from 2011. Among other trends, the fact that homes are selling in less time at higher price points should reinforce seller confidence. That’s motivating to sellers, and our market is thirsty for additional inventory.

From The Skinny Blog.

Home prices reach new record while sales growth moderates

By David Arbit on Friday, December 15th, 2017

With the majority of 2017 in the books, the Twin Cities housing market is likely to cap off another mostly positive year. Sales and prices both increased while interest rates remained attractive. More homes sold in less time and for closer to asking price. The economy remained supportive to housing by way of low unemployment and moderate job and wage growth. The biggest challenge facing the market hasn’t changed over the last several years; a persistent lack of inventory continues to frustrate buyers.

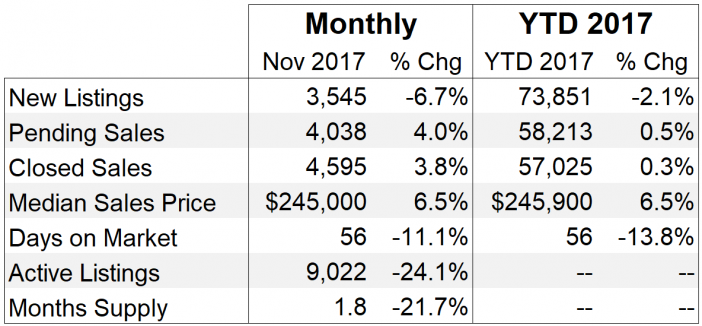
The table highlights November monthly activity as well as 2017 YTD activity with year-over-year change. New listings are down 2.1 percent for the year so far and closed sales are up 0.3 percent. Prices are likely to end the year around $245,500, up about 6.5 percent compared to 2016. At a brisk 56 days, market times are down 13.8 percent for the year, indicating sellers are accepting offers more quickly. And lastly, the number of active listings on the market is down 24.1 percent to just over 9,000 homes for sale. With months supply at just 1.8 months, absorption rates are at their lowest level in at least 15 years and indicates a sellers’ market.

Generally, five to six months of supply is considered a balanced market where neither buyers nor sellers have an edge. Given near-record demand and suppressed supply, prices scurried higher. The end of 2017 will mark the sixth consecutive year of rising home prices. Home prices are above their prior peak from 2006, as are median household incomes in the metro area.

“Sellers are generally enjoying and also encouraged by rising prices,” said Cotty Lowry, Minneapolis Area Association of REALTORS® (MAAR) President. “It speaks to the health of our region and confirms that recovery continues. But the shortage has forced many to delay listing, since most sellers are also buyers. And some buyers—mostly in the affordable price ranges—are finding it challenging to lock down the next place to call home.”

The economy and political environment also affect housing. The national unemployment rate is 4.1 percent, though it’s 2.3 percent locally—the lowest unemployment rate of any major metro area. A diverse economy supports housing, as job and wage growth are key to new household formations. The Minneapolis–St. Paul region has a resilient economy with a global reach, a talented workforce, top-notch schools, exposure to the growing technology and healthcare fields and a quality of life that’s enabled one of the highest homeownership rates in the country.

The average 30-year fixed mortgage rate declined from 4.3 percent to 3.9 percent recently, still well below its long-term average of around 8.0 percent. A third rate hike was announced this month. Additional inventory is still needed in order to offset declining affordability brought on by higher prices and interest rates.

“The year is poised to end on a mostly positive note,” said Kath Hammerseng, MAAR President-Elect. “Aside from inventory constraints and a thorny tax bill, construction activity, seller confidence and interest rates will be key indicators to watch in 2018.”
From The Skinny Blog.

Market flat in preparation for winter

By Erin Milburn on Wednesday, November 15th, 2017

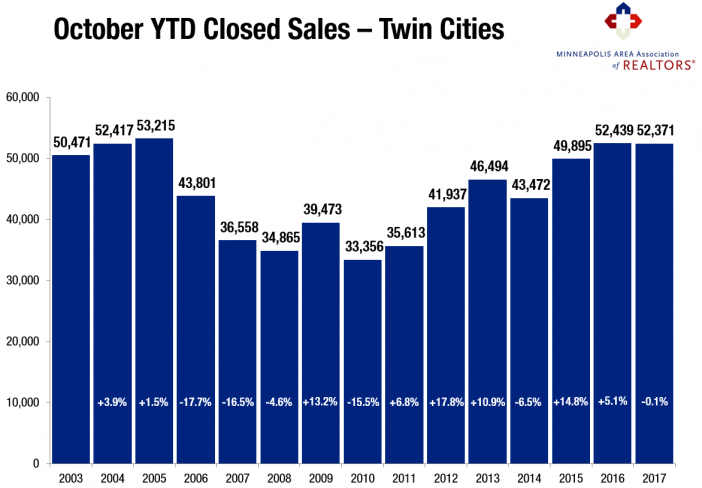
Minneapolis, Minnesota (November 15, 2017) – The Twin Cities housing market is holding steady after both sales and prices reached record highs this year. In October, new listings were up 3.1 percent compared to last October but are on-track for a 2.0 percent decline for the year. Pending sales rose 3.9 percent for the month but will likely be flat compared to all of 2016. Closed sales eked out a 0.3 percent October gain but are also likely to be flat for the year. The number of homes for sale decreased 18.0 percent to 11,221. Absorption rates contracted as well.

Given strong demand and low supply, prices held their ground and marched higher. The median sales price rose 6.1 percent from last October to $244,000. This price metric will likely show a 6.5 percent annual increase. Home prices have now risen for the last 68 consecutive months or over 5.5 years. At 52 days on average compared to 61 last October, homes went under contract 14.8 percent faster. Sellers who list their properties are averaging 97.7 percent of their original list price, 0.8 percent higher than October 2016. The metro area has just 2.2 months of housing supply. Generally, five to six months of supply is considered a balanced market where neither buyers nor sellers have a clear advantage.

“We’re still very much on-track with last year’s sales levels,” said Cotty Lowry, Minneapolis Area Association of REALTORS® (MAAR) President. “At this point in the year, we begin to look toward annual numbers that are less susceptible to weather and other variables. With only two months to go, we are running just about 70 sales shy of last year’s levels. That’s quite impressive given our dramatic supply shortage.”
Oct2017YTD_ClosedSales_PR-702x488
Headline figures can often mask important details and specifics of which buyers and seller should be aware. For example, year-to-date, closed sales only fell for homes under $250,000. Sales activity increased for homes priced between $250,000 and $500,000, $500,000 and $1,000,000 and for properties over $1,000,000. Market times and the ratio of sales price to list price both improved for each of the above four price ranges. Traditional market activity continues to eclipse distressed activity.

The economy and political climate affect housing. The national unemployment rate is 4.1 percent, though it’s 2.9 percent locally—the third lowest unemployment rate of any major metro area. A thriving and diverse economy has been conducive to housing recovery, as job and wage growth are key to new household formations and housing demand. The Minneapolis–St. Paul region has a resilient economy with a global reach, a talented workforce, top-notch schools, exposure to the growing technology and healthcare fields, and a quality of life that’s enabled one of the highest homeownership rates in the country.

The average 30-year fixed mortgage rate has declined from 4.3 percent to 3.9 percent recently, still well below its long-term average of around 8.0 percent. One additional rate hike may be in the cards this year, but the Fed is focused on unwinding its large portfolio. Additional inventory is still needed in order to offset declining affordability brought on by higher prices and interest rates.

“Keep a close eye on some of the tax reform proposals meandering through Congress,” said Kath Hammerseng, MAAR President-Elect. “Unfortunately, some of the key proposals directly harm the middle class and disincentivize homeownership while adding trillions to the debt.”
From The Skinny Blog.

Slight cool-down possible, particularly under $250,000

By Erin Milburn on Monday, October 16th, 2017

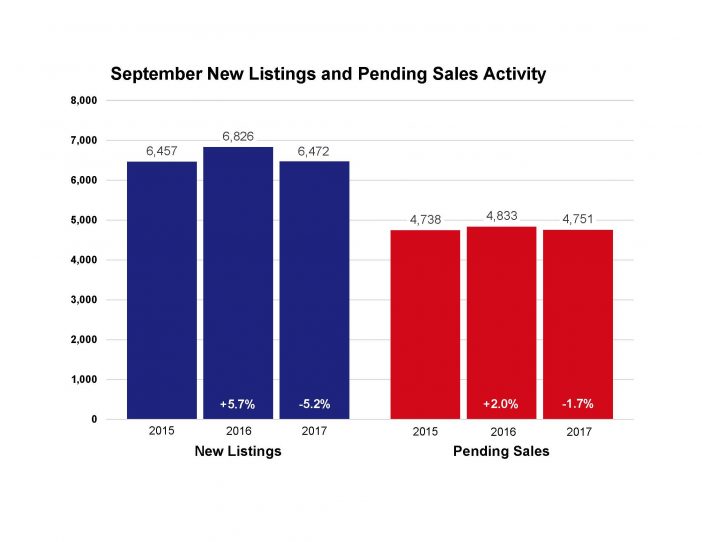
The red-hot Twin Cities housing market is starting to cool off just a bit. While June 2017 marked an all-time record for Twin Cities home sales and prices, purchase demand declined from last year for a third consecutive month. New listings decreased 5.2 percent from September 2016 to 6,472, and pending sales dipped 1.7 percent. The number of homes for sale decreased 16.7 percent to 12,502. Excluding the limited number of foreclosures and short sales, traditional new listings fell 3.6 percent while traditional pending sales increased 0.1 percent.

Since competition over limited supply remains intense, prices kept firm. The median sales price rose 7.3 percent from last year to $246,900. Home prices have now risen for the last 67 consecutive months or over 5.5 years. At 50 days on average, homes went under contract 12.3 percent faster than last September. Sellers who choose to list their properties are averaging 98.1 percent of their original list price, 0.6 percent higher than September 2016. The metro area has just 2.5 months of housing supply. Generally, five to six months of supply is considered a balanced market where neither buyers nor sellers have a clear advantage.

“There’s no other way to say it: sentiment out there may be starting to change,” said Cotty Lowry, Minneapolis Area Association of REALTORS® (MAAR) President. “Sometimes shifting markets can bring out a lot of pessimism, which can become a self-fulfilling prophecy. The likely scenario may be a brief pause in the trend we’ve seen. That’s not a bad thing, since it allows incomes a chance to catch up and takes the intensity down a notch.
Sept-2017-PR-Image-702x542”Sometimes market-wide figures mask important segment-specific realities and other indicators that buyers and sellers should be aware of. For example, closed sales only fell for homes under $250,000. Sales increased for homes priced between $250,000 and $500,000, $500,000 and $1,000,000 and for properties over $1,000,000. Market times and the ratio of sales price to list price both improved for each of the above four price ranges.

The most recent national unemployment rate is 4.4 percent, though it’s 3.4 percent locally—the third lowest unemployment rate of any major metro area. A thriving and diverse economy has been conducive to housing recovery, as job and wage growth are key to new household formations and housing demand. The Minneapolis–St. Paul region has a resilient economy with a global reach, a talented workforce, top-notch schools, exposure to the growing technology and healthcare fields, and a quality of life that’s enabled one of the highest homeownership rates in the country.

The average 30-year fixed mortgage rate has declined from 4.3 percent to 3.8 percent recently, still well below its long-term average of around 8.0 percent. One additional rate hike may be in the cards this year, but the Fed is focused on unwinding its large portfolio. Additional inventory is still needed in order to offset declining affordability brought on by higher prices and interest rates.

“Throughout the recovery, the affordable end of the market has been the focus,” said Kath Hammerseng, MAAR President-Elect. “For homes above $250,000, the market is better supplied, less competitive and is still expanding—it’s really the bottom-end of the market that’s feeling the most inventory and therefore sales pressure.”
From The Skinny Blog.

Home Prices and Mortgage Payments: A slightly complicated tango

By David Arbit on Friday, September 22nd, 2017

Since home prices for the Twin Cities metro have fully recovered and then some, it’s tempting (and even somewhat logical) to assume that monthly mortgage payments are also at all-time highs. That assumption would be entirely inaccurate. But it makes so much sense! If the median home price is at an all-time high, the monthly mortgage payment on that median priced home must therefore also be at an all-time high. Nope. Still false.

What this assumption fails to account for is of course mortgage or interest rates. The last time prices were this high, in 2006, the 30-year fixed mortgage rate was about 6.5 percent. In 2017, rates are averaging around 4.0 percent. That’s where this all-too-common assumption falls flat on its face.

The monthly payment on the median-priced home in 2006 was $1,715, but is only $1,498 in 2017, thanks to rates being 2.5 percentage points lower (6.5 vs 4.0). The median home price, however, has now reached $247,000 compared to $230,000 in 2006. So while affordability has declined since 2012, it still remains above 2004-2007 levels. In other words, despite prices being higher today than in 2006, monthly payments on purchased homes are still below where they were during the housing bubble.
Prices-vs-Payments2-702x503
From The Skinny Blog.

Inventory Crunch Weighing on Sales Activity

By Erin Milburn on Monday, September 18th, 2017

Minneapolis, Minnesota (September 18, 2017) – The Twin Cities housing market continues to show signs of high demand and short supply. While June 2017 marked an all-time home sales record for the Twin Cities, closed sales showed a year-over-year decline for the second consecutive month. The number of sellers listing their homes increased slightly, but that wasn’t enough to counteract the inventory drop. New listings increased 0.7 percent from last year to 7,264, and closed sales dipped 1.4 percent. The number of homes for sale decreased 16.7 percent to 12,602. Factoring out foreclosures and short sales, traditional new listings rose 2.4 percent while traditional closed sales increased 0.9 percent.

With many consumers competing for limited homes, prices remained firm, a trend that should continue into the fall and winter months. The median sales price rose 6.8 percent from last year to $252,000—a new monthly record for August. Home prices have now risen for the last 66 consecutive months or 5.5 years. At 48 days on average, homes went under contract 14.3 percent faster than last August. Sellers who do list are averaging 98.5 percent of their original list price, 0.6 percent higher than August 2016. The metro area has just 2.5 months of housing supply. Generally, five to six months of supply is considered a balanced market where neither buyers nor sellers have a clear advantage.

“The shortage of homes for sale is still driving this market,” said Cotty Lowry, Minneapolis Area Association of REALTORS® (MAAR) President. “It’s been the story for years, and it continues to influence prices, sales, market times and other indicators. The graphic illustrates how listings and sales have converged, leaving very little product lingering on the market.”
August-PR-Image-702x491
The shortage is most acute for entry-level homes. Well-priced, turnkey, well-presented listings are most competitive. Market times and absorption rates are tightest for homes priced under $200,000. For example, homes between $150,000 and $190,000 had 1.4 months of supply. As you move up the price ladder, the market is less competitive and better supplied. Homes priced between $500,000 and $1,000,000 boast 6.0 months of supply, while homes over $1,000,000 have a plentiful 12.3 months of supply.

The most recent national unemployment rate is 4.4 percent, though it’s 3.3 percent locally—the fourth lowest unemployment rate of any major metro area. A thriving and diverse economy has been conducive to housing recovery, as job and wage growth are key to new household formations and therefore housing demand. The Minneapolis–St. Paul region has a resilient economy with a global reach, a talented workforce, top-notch schools, exposure to the growing technology and healthcare fields, and a quality of life that’s enabled one of the highest homeownership rates in the country.

The average 30-year fixed mortgage rate has declined from 4.3 percent to 3.8 percent recently, still well below its long-term average of around 8.0 percent. Although at least one more rate hike was expected this year, the Fed is now focused on unwinding its large portfolio. Additional inventory is still needed in order to offset declining affordability brought on by higher prices and interest rates.

“We’re always impressed by how determined buyers are, despite the supply hurdle,” said Kath Hammerseng, MAAR President-Elect. “That said, prices are rising faster than incomes and builders are focusing on higher-end product further out while the demand is strongest for affordable product closer in.”

Questions? Contact David Arbit, MAAR’s Director of Research + Economics | davida@mplsrealtor.com
From The Skinny Blog.

Pricing strong, but shortage continues to hold back market activity

By Erin Milburn on Tuesday, August 15th, 2017

While June 2017 marked an all-time home sales record for the Twin Cities, closed sales retreated slightly in July compared to 2016. A slow-down in sellers listing their homes was a contributing factor, as was low inventory. New listings decreased 3.9 percent from last year to 7,227, and the number of homes for sale decreased 18.3 percent to 12,407. That was the largest inventory decline in five months. Pending sales declined 1.2 percent to 5,661, and closed sales were down 2.6 percent to 6,020. Factoring out foreclosures and short sales, traditional pending sales increased 0.7 percent to 5,484.

Weak supply and robust demand tend to encourage rising prices. The median sales price rose 5.9 percent from last year to $254,000—a new monthly record for July. Home prices have now risen for the last 65 consecutive months. At 44 days on average, homes went under contract 18.5 percent faster than last July. Despite there being fewer of them, sellers who have listed their homes recently are receiving strong offers in less time. The average percent of original list price received at sale was 99.2 percent, 0.8 percent higher than July 2016. The metro area has just 2.5 months of housing supply. Generally, five to six months of supply is considered a balanced market where neither buyers nor sellers have a clear advantage.

“The market is always adjusting to changing conditions,” said Cotty Lowry, Minneapolis Area Association of REALTORS® (MAAR) President, “Although we saw a nice gain in new construction listings in July, that segment is typically a few years behind and is a drop in the bucket compared to the existing resale market where sellers have felt stuck with nowhere to go.”
2017-08-PR-Image-702x486
Not only is the move-up market less competitive than the entry-level price points, but move-up sellers are getting strong offers on their homes in record time. Because of the fast pace of the market and lack of inventory, it’s extremely rare for sellers to carry two mortgages for more than a month.

A thriving and diverse local economy has been conducive to housing recovery, as job growth is key to new household formations. The most recent national unemployment rate is 4.3 percent, though it’s 3.5 percent locally. The Minneapolis–St. Paul region has a resilient economy with a global reach, a talented workforce, top notch schools, exposure to the growing technology and healthcare fields, and a quality of life that’s enabled one of the highest homeownership rates in the country.

The average 30-year fixed mortgage rate has declined from 4.3 percent to 3.9 percent recently, still well below its long-term average of around 8.0 percent. Excluding any surprising data or events, the Federal Reserve is likely to increase their target federal funds rate at least once more this year. Additional inventory is needed in order to offset declining affordability brought on by higher prices and interest rates.

“The fact that buyers are hardly phased by the lack of inventory speaks to the appeal of homeownership and of our region,” said Kath Hammerseng, MAAR President-Elect. “The current environment calls for additional patience, persistence and compromise, but Minnesotans are known for those traits.”

All information is according to the Minneapolis Area Association of REALTORS® (MAAR) based on data from NorthstarMLS. MAAR is the leading regional advocate and provider of information services and research on the real estate industry for brokers, real estate professionals and the public. MAAR serves the Twin Cities 13-county metro area and western Wisconsin.
From The Skinny Blog.