November a mixed bag; new listings up, sales down

December 18, 2019

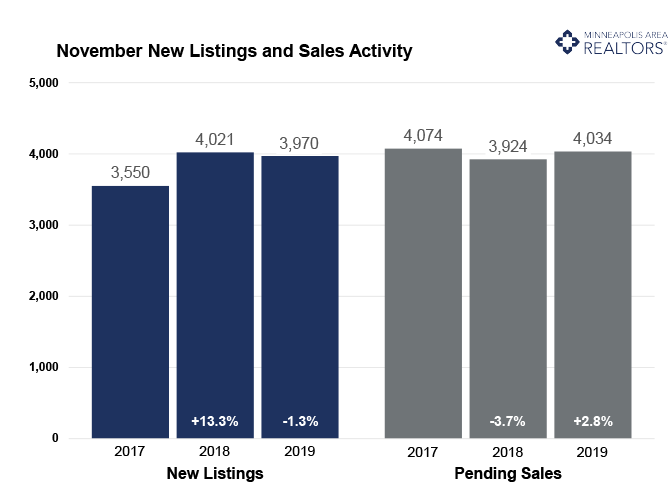
The Twin Cities real estate market showed a mostly positive but slightly mixed bag of results for November. New listings were up 0.1 percent year-to-date but down slightly in November. Helping to offset that decline was a 25.0 percent gain in newly built homes from last November. That’s because a builder doesn’t have to buy a home after selling one. Despite a sellers’ market and depending on price point, sellers still face the challenge of securing the next property while listing their current home.

Closed sales were also down slightly in November, but year-to-date closings are almost even with 2018. Sales have risen for the previous four consecutive months. Additionally, pending sales—a signed contract indicating a forthcoming closing—have now risen for five consecutive months, including November. This points to solid demand heading into the new year. Despite tight inventory, surprisingly low borrowing rates are helping to support this demand.

The number of homes for sale declined overall, but most price ranges have shown some growth this year. Over the last 12 months, housing inventory levels have increased for homes priced between $200K-$300K, $300K-$500K and over $500K but fell for homes under $200K. That first-time buyer segment still hasn’t seen supply growth.

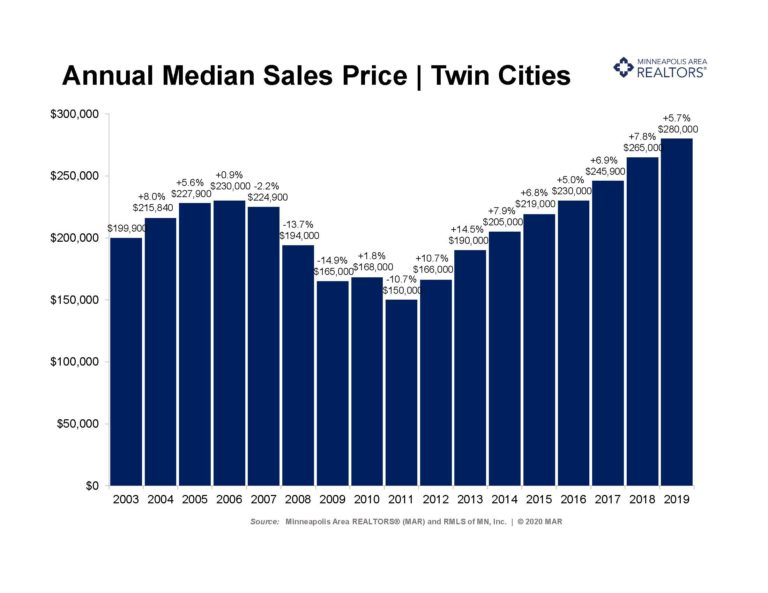
The median home price in the Twin Cities has risen for 93 months or nearly 8 years, reaching new record highs every year since 2016. This isn’t the case for every market segment or area. The supply-demand imbalance pushes prices higher along with a changing mix of homes selling. There’s been growth in luxury activity and in square footage.

Market times remain brisk and near record lows, but there were a few monthly increases in 2019. Homes priced under $250K sold in a median of 25 days, while that figure was 91 days for homes over $1M.

November 2019 by the Numbers (compared to a year ago)

Sellers listed 3,970 properties on the market, a 1.3 percent decrease from last November
Buyers closed on 4,672 homes, a 0.8 percent decrease
Inventory levels decreased 9.2 percent from last November to 10,011 units
Months Supply of Inventory was down 9.1 percent to 2.0 months
• The Median Sales Price rose 5.6 percent to $279,900
• Cumulative Days on Market declined 1.9 percent to 51 days, on average (median of 29)
• Changes in Sales activity varied by market segment

o Single family sales rose 2.1 percent; condo sales decreased 10.7 percent; townhome sales fell 4.9 percent
o Traditional sales increased 0.7 percent; foreclosure sales dropped 34.7 percent; short sales were flat
o Previously owned sales were flat; new construction sales climbed 5.3 percent

Quotables

“We’re on solid footing heading into year-end,” said Todd Urbanski, President of Minneapolis Area REALTORS®. “More inventory would be nice, but rates are fantastic, the economy is still growing and consumers are confident.”

“National news headlines have little to do with our local market,” said Linda Rogers, President-Elect of Minneapolis Area REALTORS®. “Our state and local economies are hardy and diversified, good news for home buyers.”
From The Skinny Blog.

Listings, Sales, Prices: All Rise

November 19, 2019

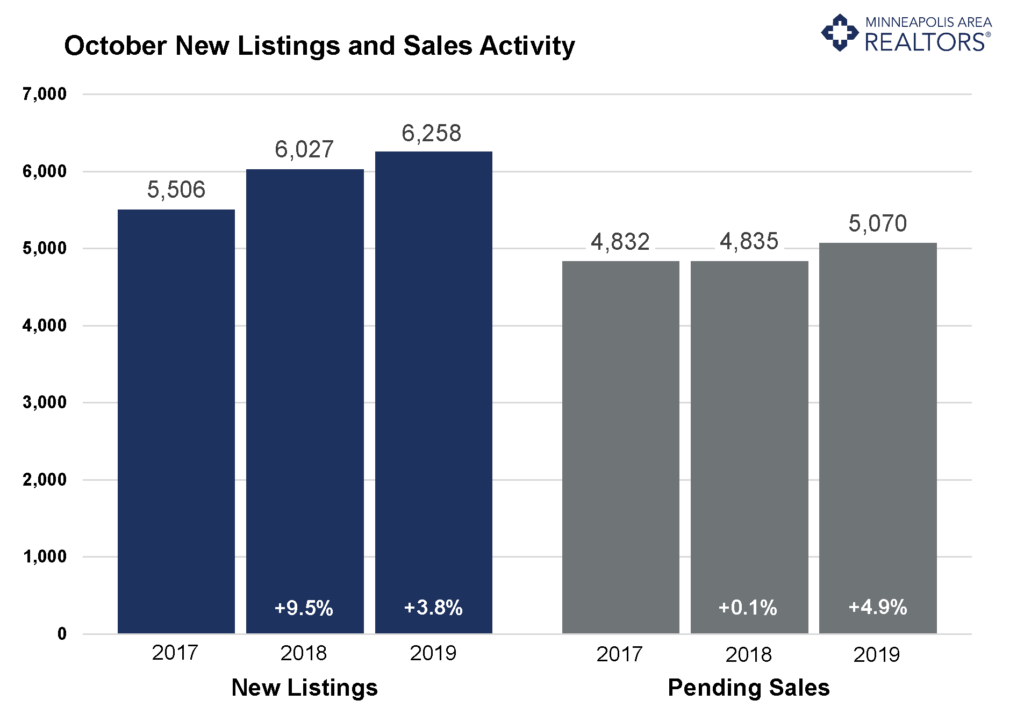
The Twin Cities real estate market started the fourth quarter of 2019 on a strong note with buyer and seller activity rising in October compared to 2018. Buoyed by historically low interest rates, the number of new listings and pending sales rose last month and the median price of a home also increased.

New listings increased by 3.8 percent last month to nearly 6,300 properties on the market. Pending home sales increased 4.9 percent in October, continuing their steady rise since mortgage rates dipped below 4.0 percent in June. The increase also puts the number of pending sales in positive territory for the year. Continuing the market’s upward trend, the median price of a home in the Twin Cities rose to $280,000 in October, a 5.7 percent increase over last year.

October reversed a trend of rising days on market and continued September’s reversal of sellers accepting a slightly lower share of their list price compared to last year. With increased sales activity, quicker market times and sellers yielding strong offers, it’s no wonder more sellers decided to list. There are still some signs that the market is rebalancing, but buyers awaiting spooky news could see their patience tested based on October numbers.

While inventory has grown this year, supply remains tight for first-time buyers and downsizing households competing for homes under $350,000. At this price point, multiple offers and homes selling for over list price in record time is still common. Builders struggle to replenish inventory due to high costs, a labor shortage and regulatory constraints. The shortage of affordable homes has prompted many owners to stay put. With 2.3 months of supply, the Twin Cities market is still significantly undersupplied.

October 2019 by the Numbers (compared to a year ago)

  • Sellers listed 6,258 properties on the market, a 3.8 percent increase from last October
  • Buyers closed on 5,391 homes, a 1.3 percent increase
  • Inventory levels decreased 5.8 percent from last October to 11,607 units
  • Months Supply of Inventory was down 8.0 percent to 3 months
  • The Median Sales Price rose 5.7 percent to $280,000
  • Cumulative Days on Market declined 4.2 percent to 46 days, on average (median of 25)
  • Changes in Sales activity varied by market segment
    • Single family sales rose 5.5 percent; condo sales increased 1.4 percent; townhome sales fell 0.5 percent
    • Traditional sales increased 4.8 percent; foreclosure sales dropped 21.1 percent; short sales fell 55.6 percent
    • Previously owned sales were up 4.4 percent; new construction sales climbed 2.6 percent

Quotables

“Interest rates are boosting buyer confidence,” said Todd Urbanski, President of Minneapolis Area REALTORS®. “Consumers may also be realizing that some of their fears around the market and economy could be overstated.”

“The latest figures show our key metrics returning to growth,” said Linda Rogers, President-Elect of Minneapolis Area REALTORS®. “We expect Minnesota and the Midwest to fare well should that change.”
From The Skinny Blog.

Sales, prices still rising despite some changes this year

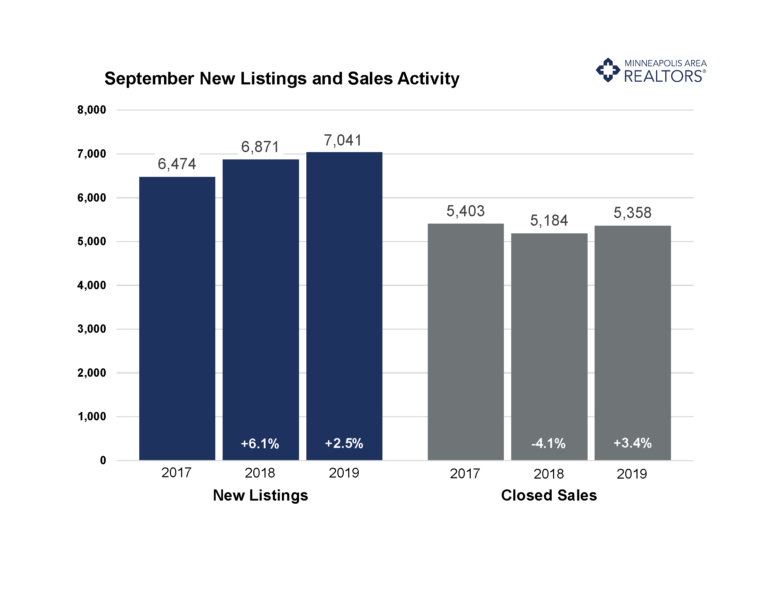
The latest numbers for Twin Cities residential real estate show a stable market with some ongoing signs of transition. Prices are still rising, supply is still tight, and demand has recovered even while market times have lengthened. Even though more buyers are closing on homes, the urgency has subsided somewhat. Days on market rose 2.4 percent from last September, marking the fifth year-over-year increase in the last seven months. Market times remain swift despite modest increases. Sales rose 3.4 percent and the median sales price increased 6.6 percent to $279,250. Pending sales—a measure of signed contracts and future demand—rose 2.9 percent. Both pending and closed sales are down slightly for the year so far, but that may change. New listings were up 2.5 percent, helping some buyers take advantage of historically low rates. Sellers have been accepting a slightly lower share of their list price compared to the year prior for seven of the last eight months—with September bucking that trend. This, along with other indicators, suggests the market is rebalancing in a way that could benefit buyers.

The number of active listings for sale is up over the last 12 months and for most of 2019. Even so, the market remains tight—particularly for first-time buyers and downsizers competing in the under $300,000 segment where multiple offers and homes selling for over list price remain commonplace. Despite the demand, builders struggle to replenish inventory in that undersupplied segment due to high land and material costs combined with a significant labor shortage and tricky regulations. The shortage of affordable homes has led to an increase in remodeling as people are staying in their homes longer. It’s challenging to find comparable home at a similar payment in the desired location. With just 2.5 months of supply, the Twin Cities is still significantly undersupplied.


September 2019 by the Numbers (compared to a year ago)

  • Sellers listed 7,041 properties on the market, a 2.5 percent increase from last September
  • Buyers closed on 5,358 homes, a 3.4 percent increase
  • Inventory levels decreased 5.6 percent from last September to 12,478 units
  • Months Supply of Inventory was down 7.4 percent to 5 months
  • The Median Sales Price rose 6.6 percent to $279,250
  • Cumulative Days on Market rose 2.4 percent to 43 days, on average (median of 22)
  • Changes in Sales activity varied by market segment
    • Single family sales rose 5.5 percent; condo sales increased 1.4 percent; townhome sales fell 0.5 percent
    • Traditional sales increased 4.8 percent; foreclosure sales dropped 21.1 percent; short sales fell 55.6 percent
    • Previously owned sales were up 4.4 percent; new construction sales climbed 2.6 percent

Quotables

“Attractive interest rates have unleashed some of the pent-up demand from earlier this year,” said Todd Urbanski, President of Minneapolis Area REALTORS®. “But each price point, product type and area is unique.”

“Buyers are still very much motivated despite some challenges,” said Linda Rogers, President-Elect of Minneapolis Area REALTORS®. “It really shows the resilience of our region and the value of homeownership.”
From The Skinny Blog.

Things still feeling pretty stable out there, thanks for asking

September 18, 2019

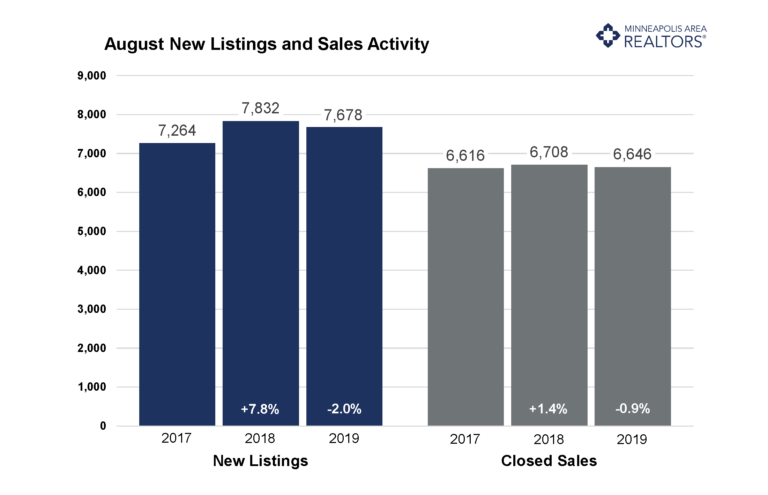
With two-thirds of the year in the books, we’re getting a clearer picture of where the housing market stands. The latest numbers for Twin Cities residential real estate show stability along with signs of deceleration. The median sales price continued to rise, landing at $286,800 for the month. Pending sales—a measure of signed contracts and future demand—rose 3.2 percent but are down slightly for the year so far. New listings slipped 2.0 percent, thwarting some buyers’ hopes of taking advantage of historically low rates. Closed sales were down 0.9 percent for the month and are down 1.4 percent for the year. One sign of market shift is days on market, which rose 2.5 percent year-over-year. Market times remain swift, but that’s the fourth year-over-year increase this year. Another sign of a changing market is the ratio of sold to list price. Sellers have been accepting a slightly lower share of their list price compared to the year prior for seven of the last eight months. This, along with other indicators, suggests the market is rebalancing. The landscape seems to be improving for buyers, even though sellers still have strong pricing power, favorable negotiating leverage and quick market times.

The number of active listings for sale has been rising this year. Even so, the market remains tight—particularly for first-time buyers and downsizers competing in the sub-$300,000 segment where multiple offers and homes selling for over list price are commonplace. With just 2.5 months of supply, the Twin Cities is still significantly undersupplied. The move-up and upper-bracket segments are less competitive and better supplied. Given some of the recent economic uncertainty, it’s worth noting that the Twin Cities market is well-positioned to withstand an economic downturn.

August 2019 by the Numbers (compared to a year ago)

Sellers listed 7,678 properties on the market, a 2.0 percent decrease from last August
Buyers closed on 6,646 homes, a 0.9 percent decrease
Inventory levels decreased 5.5 percent from last August to 12,238 units
Months Supply of Inventory was down 3.8 percent to 2.5 months
The Median Sales Price rose 7.0 percent to $286,800, a record high for August
Cumulative Days on Market rose 2.5 percent to 41 days, on average (median of 21)
Changes in Sales activity varied by market segment

Single family sales rose 1.4 percent; condo sales decreased 6.2 percent; townhome sales fell 7.8 percent
Traditional sales increased 0.1 percent; foreclosure sales dropped 40.9 percent; short sales fell 45.5 percent
Previously owned sales were down 0.1 percent; new construction sales declined 5.0 percent

Quotables

“Some think the fall market isn’t for them, but tight conditions and favorable rates suggest momentum moving into 2020,” said Todd Urbanski, President of Minneapolis Area REALTORS®. “We’re at a moment when sellers are enjoying their position while buyers are taking advantage of lower than expected interest rates and more options.”

“Most markets remain stable across the metro,” said Linda Rogers, President-Elect of Minneapolis Area REALTORS®. “While there is a good amount of local variation, we just don’t see that many signs for concern.”
From The Skinny Blog.

Inventory and Interest Rates Likely Driving Sales Growth

August 19, 2019

The current economic expansion recently became the longest on record, but it’s showing its age. Concerns around slowing growth have spiked amidst new economic data and gyrations in equity markets, but it’s also created opportunities for home buyers. The upside is that mortgage rates have fallen yet again as investors flock to the safety of longer-term U.S. government bonds, thereby driving down the 10-year treasury yield and the 30-year mortgage rates that follow it. That means markets expect monetary easing and lower interest rates to spur growth in the short-term. The risk of recession has grown, but the economy is still buzzing along at a decent pace. Buying a home is an emotional decision, and buyers sometimes pull back at any whiff of turbulence out of fear of hardship.

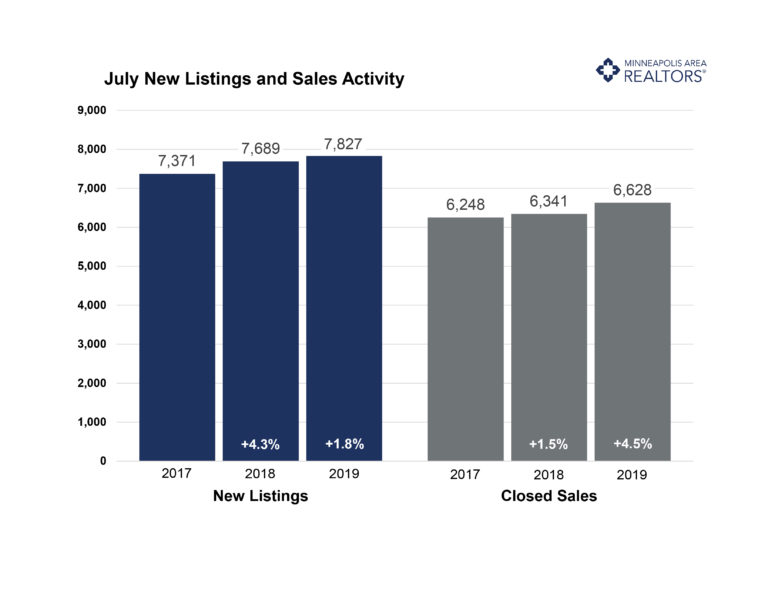
Twin Cities home buyers and sellers, however, did not pull back in July. Sales rose 4.5 percent and sellers even listed almost 2.0 percent more product than last July. Despite lower interest rates and modest inventory gains as tailwinds, the persistent shortage of homes on the market and affordability headwinds remain. Price increases and wage gains are more aligned now than in the past, but investors are still competing with millennial first-time buyers in the already competitive under $300,000 segment. Conversely, there’s some evidence of a slow-down in the luxury segment. Metrics to watch aside from sales and prices include market times, the ratio of sold to list price and months of supply. These three indicators could be hinting at potential market shifts ahead. That said, home price declines are unlikely until absorption rates rise above 6 months. We’re currently at 2.4 months.

July 2019 by the Numbers (compared to a year ago)

  • Sellers listed 7,827 properties on the market, a 1.8 percent increase from last July
  • Buyers closed on 6,628 homes, a 4.5 percent increase
  • Inventory levels decreased 4.4 percent from last July to 11,961 units
  • Months Supply of Inventory was down 4.0 percent to4 months
  • The Median Sales Price rose 5.9 percent to $283,700, a record high for July
  • Cumulative Days on Market remained stable at 38 days, on average (median of 18)
  • Changes in Sales activity varied by market segment
    • Single family sales rallied 6.0 percent; condo sales increased 2.2 percent; townhome sales rose 0.8 percent
    • Traditional sales increased 5.6 percent; foreclosure sales dropped 17.6 percent; short sales fell 37.5 percent
    • Previously owned sales were up 5.6 percent; new construction sales rose 4.5 percent

Quotables

“There are lots of headlines out there vying for our attention,” said Todd Urbanski, President of Minneapolis Area REALTORS®. “The bottom line is that the best time to buy a home is when you’re ready. Over 70.0 percent of Minnesotans have made that choice, the vast majority of whom have seen their values increase.”

“No one thought mortgage rates would touch 3.6 percent again,” said Linda Rogers, President-Elect of Minneapolis Area REALTORS®. “Buyers who felt squeezed by a monthly mortgage payment should take another look and consider this a fleeting gift.”
From The Skinny Blog.

Some mixed signals but market fundamentals remain intact

July 18, 2019

In the face of mixed signals, assessing market health can be a challenge. The economy remains healthy, mortgage rates are outrageously low and yet sales aren’t rising. That’s in part because we simply haven’t built enough homes to keep pace with the demand. Despite attractive mortgage rates, the supply of available homes is so tight that sales are struggling to keep pace. Rising home prices typically incentivize more sellers to list. But with nowhere to go because of the shortage, listing activity is down. New construction has been hampered by rising land, labor and material prices as well as regulation, forcing builders to create new supply in the high-end luxury market often at the expense of more affordable entry-level product. But the demand from millennials (and some baby boomers) is concentrated in the affordable price points, creating multiple-offers and frustrated buyers.

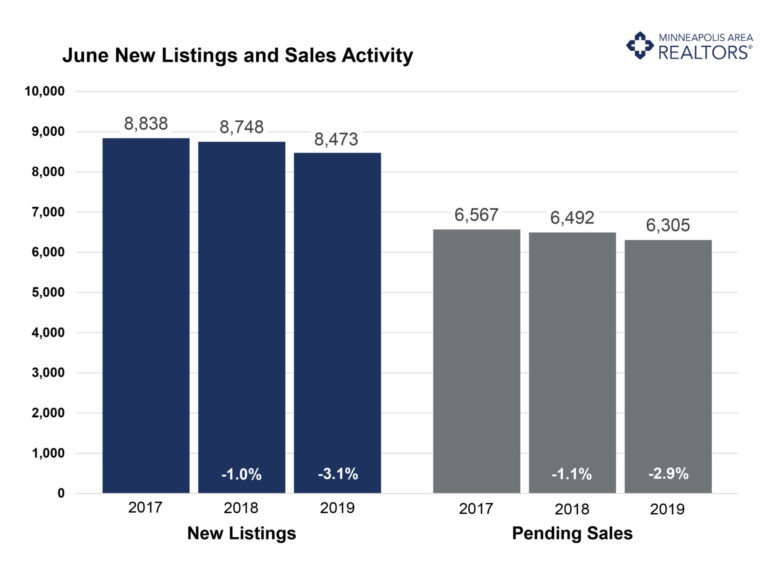
But it’s that tight inventory that’s still driving prices higher. Sales prices reached a new all-time high of $290,000 in June—likely our high for the year. New listings stumbled 3.1 percent while pending sales were down 2.9 percent. Days on market remained flat compared to June 2018 while the ratio of sold to list price fell for a fifth consecutive month. In some ways, the market is improving for buyers, even though sellers are still enjoying strong pricing power, favorable negotiating leverage and quick market times. For the last nine months, buyers have seen more active listings for sale than the year prior. We still have a tale of two markets: strong demand, weak supply and price growth in the affordable brackets compared to a slight oversupply, slow market times and weaker pricing in the upper brackets.


June 2019 by the Numbers (compared to a year ago)

  • Sellers listed 8,473 properties on the market, a 3.1 percent decrease from last June
  • Buyers closed on 6,604 homes, an 8.2 percent decline
  • Inventory levels decreased 1.3 percent from last June to 12,063 units
  • Months Supply of Inventory was flat at5 months
  • The Median Sales Price rose 7.2 percent to $290,000, a record high for any month
  • Cumulative Days on Market remained stable at 40 days, on average (median of 16)
  • Changes in Sales activity varied by market segment
    • Single family sales fell 7.5 percent; condo sales fell 13.3 percent; townhome sales decreased 6.1 percent
    • Traditional sales declined 6.8 percent; foreclosure sales dropped 46.4 percent; short sales fell 48.1 percent
    • Previously owned sales were down 8.1 percent; new construction sales rose 2.0 percent

Quotables

“The market is quiet right now, not every month shows significant change. Inventory is low, buyer demand is still evident and interest rates are phenomenal,” said Todd Urbanski, President of Minneapolis Area REALTORS®. “The untold story is the increase in net worth for homeowners. Rising prices mean rising equity. It can be a challenge to find a home, but homeownership is the best avenue to wealth-building.”

“The idea of the ‘housing market’ as a singular entity can be misleading,” said Linda Rogers, President-Elect of Minneapolis Area REALTORS®. “Cities, neighborhoods and different segments can often show tremendous variation.”
From The Skinny Blog.

Early 2019 Weakness Proving Temporary; Market Back On Track

June 18, 2019

There have been two disruptions to the housing market over the last nine months, but their effects are proving short-lived. First, a sudden increase in interest rates in late 2018 weighed on December and January sales activity. Second, record snow and the subsequent melt in February and March of this year weighed on sales activity in March and April. But May numbers are showing growth in seller activity, pending and closed buyer activity as well as quicker market times and rising prices.

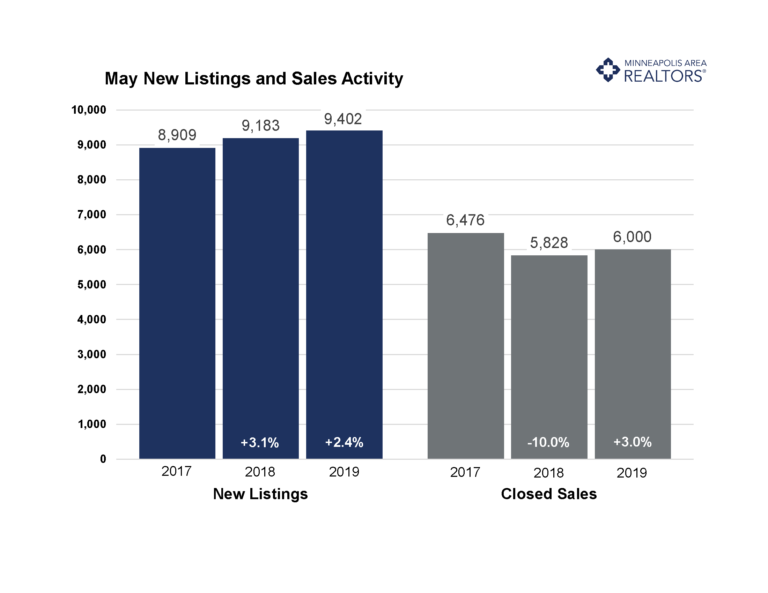
Prices reached a new all-time high of $285,000. New listings rose 2.4 percent while closed sales were up 3.0 percent. After two months of increases, market times sped up by 4.3 percent compared to May 2018. The ratio of sold to list price fell for a fourth consecutive month, but by the smallest amount since February. In conjunction with other indicators, the market is improving for buyers, even though sellers still enjoy strong pricing power, favorable negotiating leverage and quick market times. For the last nine months, buyers have seen more active listings for sale than the year prior. Mortgage rates remain very attractive at around 3.85 percent on a 30-year fixed loan—far lower than anyone predicted by this time. We still have a tale of two markets: strong demand, weak supply and price growth in the affordable brackets but oversupply and slow market times in the upper brackets.

May 2019 by the Numbers (compared to a year ago)

  • Sellers listed 9,402 properties on the market, a 2.4 percent increase from last May
  • Buyers closed on 6,000 homes, a 3.0 percent increase
  • Inventory levels for May increased 0.5 percent compared to 2018 to 11,327 units
  • Months Supply of Inventory was flat at 3 months
  • The Median Sales Price rose 5.2 percent to $285,000, a record high for any month
  • Cumulative Days on Market decreased 4.3 percent to 45 days, on average (median of 17)
  • Changes in Sales activity varied by market segment
    • Single family sales rose 2.7 percent; condo sales rallied 9.9 percent; townhome sales increased 3.1 percent
    • Traditional sales increased 4.4 percent; foreclosure sales declined 26.8 percent; short sales fell 28.6 percent
    • Previously-owned sales were up 2.9 percent; new construction sales surged 10.5 percent

Quotables

“We’re still seeing some rebalancing, but it just isn’t as dire as some want us to believe,” said Todd Urbanski, President of Minneapolis Area REALTORS®. “Rates under 4.0 percent is a significant motivator for buyers.”

“Not everyone understands that all real estate is local,” said Linda Rogers, President-Elect of Minneapolis Area REALTORS®. “Shifts in other regions have very little impact on our local market dynamics.”
From The Skinny Blog.

Prices rising, pending sales stable amidst market rebalancing

Gardeners aren’t the only ones struggling with spring weather this year. The season’s late start and temperature swings suppressed housing market activity early this year, but those effects are moderating. The latest numbers for Twin Cities residential real estate show some strength amidst ongoing signs of change. Prices reached a new record of $281,000. New listings reversed course and rose 4.5 percent. Closed sales were down about 7.0 percent though pending sales—a measure of future closings—fell just 1.1 percent. Market times rose 5.7 percent year-over-year, the second increase since March 2015. Another sign of a changing market is the ratio of sold to list price has fallen for five of the last six months. In conjunction with other indicators, this suggests the market is improving for buyers, even though sellers still have strong pricing power, favorable negotiating leverage and quick market times.

The number of active listings for sale decreased slightly compared to the prior year. Even so, buyers have seen inventory gains for seven of the last eight months. After seven months of gains, months supply was flat at 2.0 months, suggesting the market is still undersupplied. Well-priced, turnkey properties continue to be highly sought-after. Mortgage rates remain cooperative at around 4.1 percent, which is good news for buyers. The market is tightest at the entry-level prices, where multiple offers and homes selling for over list price are commonplace. The move-up and upper-bracket segments are less competitive and better supplied.

April 2019 by the Numbers (compared to a year ago)

Sellers listed 7,679 properties on the market, a 4.5 percent increase from last April
Buyers closed on 4,384 homes, a 6.9 percent decrease
Inventory levels for April declined 1.2 percent compared to 2018 to 9,667 units
Months Supply of Inventory was flat at 2.0 months
The Median Sales Price rose 5.2 percent to $281,000, a record high for any month
Cumulative Days on Market rose 5.7 percent to 56 days, on average (median of 21)
Changes in Sales activity varied by market segment

Single family sales declined 7.1 percent; condo sales rose 9.1 percent; townhome sales fell 9.1 percent
Traditional sales decreased 5.2 percent; foreclosure sales declined 30.3 percent; short sales fell 38.9 percent
Previously-owned sales were down 8.9 percent; new construction sales surged 20.3 percent

Quotables

“Things still seem to be rebalancing a bit,” said Todd Urbanski, President of Minneapolis Area REALTORS®. “Low and stable rates have definitely helped, and so has the ongoing economic expansion.”

“We’re doing better here than many other parts of the country,” said Linda Rogers, President-Elect of Minneapolis Area REALTORS®. “It’s important for buyers and sellers to understand local dynamics, not national headlines.”

All information is according to the Minneapolis Area REALTORS® based on data from NorthstarMLS. Minneapolis Area REALTORS® is the leading regional advocate and provider of information services and research on the real estate industry for brokers, real estate professionals and the public. We serve the Twin Cities 16-county metro area and western Wisconsin.

From The Skinny Blog.

Buyer and seller activity down; weather partly to blame

If February was the month of record snowfall, March was the month of record wet basements. The effects of extreme weather continue to impact the market. Despite that, the latest numbers for Twin Cities residential real estate show some strength amidst ongoing signs of change. Prices continued to climb, reaching a new record. New listings fell 8.8 percent as fewer sellers listed their properties. Closed sales were down 9.3 percent as some buyers waited on soggy properties as well as additional inventory options. Market times rose year-over-year for the first time since March 2015. Another sign of a changing market is the ratio of sold to list price has fallen for four of the last five months. This—along with other indicators—suggest the market is improving for buyers, even though sellers still have strong pricing power, favorable negotiating leverage and quick market times.

The number of active listings for sale decreased compared to the prior year. Even so, buyers have seen inventory gains for five of the last six months. Months supply, however, was flat at 1.8 months, suggesting the market is still tight but realigning. Buyers should still expect competition on the most coveted listings. After touching 5.0 percent in November, mortgage rates have settled back down around 4.1 percent, which is great news for buyers. The supply squeeze is most evident at the entry-level prices, where multiple offers and homes selling for over list price are commonplace. The move-up and upper-bracket segments are less competitive and better supplied.

March 2019 by the Numbers (compared to a year ago)

  • Sellers listed 6,160 properties on the market, an 8.8 percent decrease from last March
  • Buyers closed on 3,673 homes, a 9.3 percent decrease
  • Inventory levels for March declined 4.2 percent compared to 2018 to 8,685 units
  • Months Supply of Inventory was flat at 1.8 months
  • “There’s plenty of buyers and sellers out there looking to get deals done,” said Linda Rogers, President-Elect of Minneapolis Area REALTORS®. “If rates and inventory cooperate, we’re still anticipating a solid year.”
  • The Median Sales Price rose 6.5 percent to $275,000, a record high for any month
  • Cumulative Days on Market rose 15.8 percent to 66 days, on average (median of 30)
  • Changes in Sales activity varied by market segment
    • Single family sales declined 7.2 percent; condo sales sank 16.5 percent; townhome sales fell 12.2 percent
    • Traditional sales decreased 7.9 percent; foreclosure sales declined 26.8 percent; short sales fell 32.3 percent
    • Previously-owned sales were down 10.1 percent; new construction sales rose 2.3 percent

    Quotables

    “The extremes of February and March are still noticeable,” said Todd Urbanski, President of Minneapolis Area REALTORS®. “It’s difficult to disentangle weather-induced market shifts with organic market shifts.”

    All information is according to the Minneapolis Area REALTORS® based on data from NorthstarMLS. Minneapolis Area REALTORS® is the leading regional advocate and provider of information services and research on the real estate industry for brokers, real estate professionals and the public. We serve the Twin Cities 16-county metro area and western Wisconsin.
    From The Skinny Blog.

Extreme February Weather Leaves Dent on Residential Market Stats

Winter sports enthusiasts likely enjoyed the snowiest February on record more than those attempting to buy and sell homes. Even so, the latest numbers for Twin Cities residential real estate show some strength amidst ongoing signs of change. Sellers showed a sizeable, weather-related decline in listing activity, while buyers entered into fewer contracts than last February even while closed sales rose. Market times flattened out as the median sales price continued to rise compared to last year. One sign of a changing market is the fact that the ratio of sold to list price has fallen for three of the last four months. This—along with other indicators—suggest the market is improving for buyers, even though sellers still have strong pricing, favorable negotiating leverage and quick market times.

Due to the decline in new listings, the number of active listings for sale decreased compared to the prior year. Even so, buyers have seen inventory gains for four of the last five months. Months supply followed suit, tick down to 1.6 months, suggesting the market is still tight. Buyers should expect competition on the most sought-after listings and neighborhoods. After increasing to 5.0 percent in November, mortgage rates have settled back down around 4.5 percent. That’s great news for buyers. The supply squeeze is most evident at the entry-level prices, where multiple offers and homes selling for over list price are commonplace. The move-up and upper-bracket segments are less competitive and better supplied. Inventory could rise substantially, and we’d still have a balanced market.

February 2019 by the Numbers (compared to a year ago)

Sellers listed 4,355 properties on the market, a 14.3 percent decrease from last February
Buyers closed on 2,798 homes, a 4.0 percent increase
Inventory levels for February declined 5.7 percent compared to 2018 to 7,936 units
Months Supply of Inventory decreased 5.9 percent to 1.6 months
The Median Sales Price rose 6.2 percent to $265,500, a record high for February
Cumulative Days on Market was flat at 69 days, on average (median of 43)
Changes in Sales activity varied by market segment

Single family sales rose 6.7 percent; condo sales fell 0.9 percent; townhome sales increased 1.0 percent
Traditional sales increased 7.4 percent; foreclosure sales sank 40.3 percent; short sales fell 41.4 percent
Previously-owned sales were up 4.7 percent; new construction sales rose 5.3 percent

Quotables

“The cold and snow in February was certainly an impediment,” said Todd Urbanski, President of Minneapolis Area REALTORS®. “The March numbers will offer more clarity on market direction.”

“We’re still sensing plenty of interest from buyers and sellers,” said Linda Rogers, President-Elect of Minneapolis Area REALTORS®. “This spring market should be productive, especially with more inventory.”

All information is according to the Minneapolis Area REALTORS® based on data from NorthstarMLS. Minneapolis Area REALTORS® is the leading regional advocate and provider of information services and research on the real estate industry for brokers, real estate professionals and the public. We serve the Twin Cities 16-county metro area and western Wisconsin.
From The Skinny Blog.