Traditional Sales Dominating the Housing Market

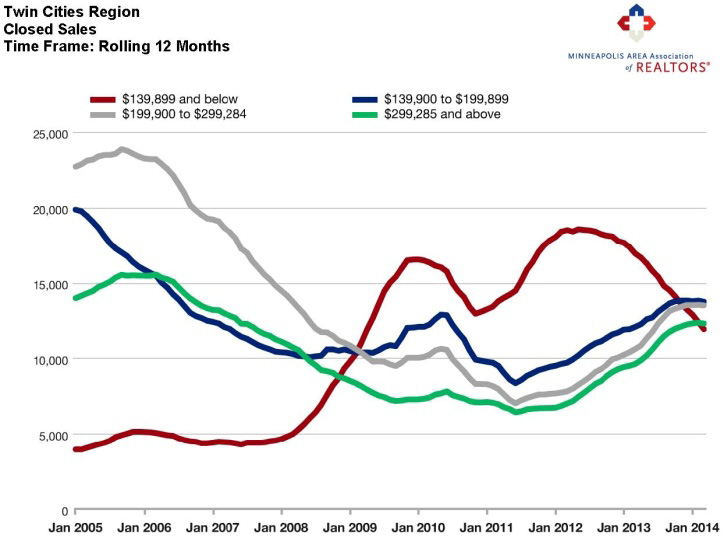
Home sales in the 13-county Minneapolis–St. Paul metropolitan area have appeared lackluster of late on the surface, but if you turn the dirt, you’ll see more intriguing colors in the flowering market mix. Overall closed sales were down 11.9 percent to 3,806 for April 2014, but traditional sales were actually up 1.4 percent. The total was brought down by a 41.8% decline in foreclosure sales and 40.8% decrease in short sales.

Increased seller activity is critical to replenishing inventories. New listings rose 10.2 percent to 7,776 newly listed homes, a welcome sign for prospective buyers. Inventory levels are still constrained, but consumers should have more options to choose from this year than last year.

With higher prices and more buyers on the prowl, more sellers are able to go the traditional route. Traditional new listings rose 25.7 percent compared to last year at this time, while foreclosure and short sale new listings fell 41.6 percent and 49.6 percent, respectively.

On the demand side, pending sales declined 3.9 percent to 5,127 properties overall, once again reflecting less distressed market activity. Traditional pending sales were up 8.2 percent while pending foreclosure and short sales fell 40.4 and 35.1 percent, respectively. The inventory of homes for sale in the Twin Cities is now at 14,429 properties, 1.5 percent more than last year at this time, marking the first year-over-year increase since October 2013 and the largest increase since January 2011.

6a00e54ee9620b883401a511b6a111970c-800wi

“We’re seeing the return of a real estate market led by traditional listings and sales,” said Emily Green, President of the Minneapolis Area Association of REALTORS® (MAAR). “Coupled with more inventory – attractive inventory – it’s setting up to be an exciting year for buyers and sellers.”

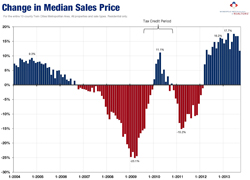
As a result of the ongoing shift in the types of homes being sold, the median sales price for the metro rose 8.0 percent to $197,000. That’s 26 straight months of year-over-year price gains. Foreclosures and short sales now make up just 11.4 percent of all new listings. Last April, they made up 22.4 percent. For closed sales, the number fell from 31.3 to 20.9 percent.

On average, homes spent 89 days on the market, down 8.2 percent from last April. Sellers are receiving an average of 95.9 percent of their original list price. The Twin Cities now has 3.4 months’ supply of inventory, the same mark that it was last April.

“Distressed inventory has made up the majority of the lower price ranges, and that market is evaporating,” said Mike Hoffman, MAAR President-Elect. “We can anticipate more negotiations and transactions with people rather than banks.”

All information is according to the Minneapolis Area Association of REALTORS® (MAAR) based on data from NorthstarMLS. MAAR is the leading regional advocate and provider of information services and research on the real estate industry for brokers, real estate professionals and the public. MAAR serves the Twin Cities 13-county metro area and western Wisconsin. 10K Research and Marketing, LLC is a wholly owned subsidiary of MAAR.

Traditional Segment Blooms, Sellers More Optimistic

After being cooped up for a long, cold winter, homeowners in the 13-county Minneapolis-St. Paul metropolitan area showed renewed signs of optimism in March. Seller activity rose 5.5 percent to 6,492 newly listed homes, a crucial increase toward fueling buyer demand. Inventory levels are still hovering near a 10-year low, but consumers should have more options to choose from this year compared to recent years. Pending sales were 8.4 percent lower, resulting from a desired shift to less foreclosure and short sale activity. Most indicators continue to suggest ongoing recovery and stabilization.

It’s imperative to understand market activity by segment. Buyers are now leaning toward traditional purchases first because they are making up a greater share of the marketplace. These properties also tend to be in better condition, many come with warranties and traditional sellers tend to be more cooperative than banks. New traditional listings rose 22.1 percent compared to March 2013, while foreclosure and short sale new listings fell 39.9 and 53.8 percent, respectively.

On the demand side, pending sales declined 8.4 percent to 4,141 properties overall, which still reflects less distressed market activity. Once again, traditional pending sales were up 2.6 percent while pending foreclosure and short sales fell 32.2 and 45.1 percent, respectively. Consumers shopping for homes now have 13,086 properties to choose from – or 4.1 percent fewer than last year at this time, marking the smallest year-over-year decline since November 2013.

“There’s a lot of excitement and positive energy out there, especially among sellers,” said Emily Green, President of the Minneapolis Area Association of REALTORS® (MAAR). “Some would-be sellers have been lifted out from underwater by rising prices and less competition from foreclosures, while other move-up buyers are also eager to buy.”

The lowest price point of the market is evaporating. As a result, the median sales price for the metro rose 7.6 percent to $190,000, marking 25 straight months of year-over-year price gains. Last March, foreclosures and short sales made up 25.2 percent of all new listings. This March, they made up just 13.3 percent. For closed sales, the number fell from 37.6 to 26.6 percent.

On average, homes spent just 95 days on the market, 12.0 percent less than last March. Sellers are receiving an average of 95.0 percent of their original list price. The Twin Cities now has 3.1 months’ supply of inventory, suggesting a favorable selling environment. Importantly, interest rates remain affordable and well below their long-term average.

“Traditional properties are dominating the market again,” said Mike Hoffman, MAAR President-Elect. “As distressed product clears the pipeline, consumers are more likely to embark upon negotiations and transactions with people rather than banks.”

Old Man Winter, Low Inventory and Fewer Foreclosures Weigh on Sales

Minneapolis, Minnesota (March 12, 2014) – The 13-county Minneapolis-St. Paul metropolitan area housing market was negatively affected by the extreme winter. Inventory levels are also still hovering at a 10-year low, meaning consumers have far less product to purchase than in recent years. Another factor dragging down the headline numbers is the shift away from distressed homes and back toward traditional activity. Most indicators continue to suggest ongoing recovery, stabilization and normalization. Spring will offer better clues as to the health of the Twin Cities housing market.

Although new listings declined 5.0 percent to 4,616 overall, seller activity is likely to pick up during the spring and summer months. Additionally, and as has been the case for 22 consecutive months, new listings in the higher-priced traditional segment rose 9.1 percent over the same period, while foreclosure and short sale new listings fell 34.5 and 54.6 percent, respectively.

On the demand side, closed sales were down 14.0 percent to 2,465 properties overall, which speaks to the low number of weather-impeded purchase agreements entered into during January. Once again, traditional closed sales were up 6.7 percent while foreclosure sales and short sales fell 33.4 and 61.9 percent, respectively. Consumers shopping for homes now have 11,975 properties to choose from – or 9.6 percent fewer than February 2013.

“It was an interesting month,” said Emily Green, President of the Minneapolis Area Association of REALTORS® (MAAR). “While the market shifts back toward where it was before the bubble, we expect to see foreclosures and short sales become less prevalent, which can dilute overall numbers. Then you have the weather.”

As a result of this shift, the median sales price for the metro rose a strong 14.4 percent to $183,044, officially marking 24 straight month of year-over-year median price gains. Last February, foreclosures and short sales comprised 43.9 percent of all closed sales. This February, these segments made up 30.3 percent of all sales. Traditional homes are selling at a median price of $210,000; foreclosures for $131,100; short sales for $150,000.

On average, homes spent just 99 days on the market, 10.8 percent less than last year. Sellers are receiving an average of 93.5 percent of their original list price. The Twin Cities now has 2.8 months’ supply of inventory, suggesting a favorable selling environment. Importantly, interest rates remain affordable and well below their long-term average.

“The fundamentals haven’t changed.” said Mike Hoffman, MAAR President-Elect. “Our local economy is diverse and growing and so is our population. It’s important not to read too much into minor fluctuations like this.”

2013 Annual Wrap-Up: Widespread Market Recovery Continues

Lower supply levels, strong demand and higher prices are among the encouraging developments in 2013 that brought about ongoing market recovery. Consumer purchase demand increased notably, reaching levels not seen since 2005. As the active supply of homes for sale fell to an 11-year low, absorption rates improved to levels not seen since before 2003. Low but upwardly-mobile interest rates, affordable prices and record housing affordability resulted in an 8.8 percent increase in home sales for the 13-county metro.

2013 by the Numbers

• Sellers listed 72,128 properties on the market, a 9.4 percent increase from 2012 and the first gain in seven years.
• Buyers closed on 53,087 homes, up 8.8 percent from 2012 and the highest figure since 2005.
• Inventory levels dropped 10.5 percent from 2012 to 11,646 units, the lowest level in 11 years.
• Months Supply of Inventory dropped 18.8 percent to 2.6 months, also an 11-year low.
• The Median Sales Price of closed sales rose 14.4 percent to $192,000, marking a five-year high. o This measure of home prices is 16.5 percent below its 2006 peak and 28.0 percent above its 2011 valley
• Cumulative Days on Market was down 29.1 percent to 83 days, on average—an eight-year record pace.
• Lender-mediated properties made up a significantly smaller share of overall activity across multiple metrics
• 21.6 percent of all New Listings were lender-mediated (either foreclosures or short sales), down from 34.7 percent in 2012 and 41.9 percent in 2011
• 25.6 percent of all Inventory was lender-mediated, down from 38.8 percent in 2012 and 44.4 percent in 2011
• 26.4 percent of all Closed Sales were lender-mediated, down from 39.7 percent in 2012 and 50.0 percent in 2011

Potent Quotables

“We are quite pleased with the breadth and depth of this recovery. The increase in seller activity was hugely important. Motivated by still-low interest rates, rising rents and more job opportunities, buyers drove home sales to an eight-year high,” said Emily Green, President of the Minneapolis Area Association of REALTORS®.

“As always, market conditions vary from neighborhood to neighborhood, but homeowners are feeling energized by these ongoing improvements,” said Michael Hunstad, President of the Saint Paul Area Association of REALTORS®. “Though markets vary, many areas of the metro are seeing homes selling in record time and with multiple offers.”

Improvements in the local economy will boost the Twin Cities real estate market in 2014. The outlook is positive: job growth is accelerating, interest rates remain attractive and an unemployment rate well below the nation’s are all reasons our region continues to outperform.

Lighter Foreclosure and Short Sale Load Continues to Help the Market

6a00e54ee9620b8834019b029cac33970c-800wiThe 13-county Minneapolis-St. Paul metropolitan area housing market continued to settle itself in November. While some measures of housing demand may suggest a slowdown, most deceleration is the result of a healing lender-mediated (foreclosures and short sales) segment, which made up a smaller share of the residential pie compared to last year.

For the first time in seven months, new listings were lower year over year, declining 5.3 percent to 3,900, but traditional new listings rose 11.1 percent over the same time comparison. Buyers closed on 3,760 homes, a 5.9 percent decrease from last November, even though traditional sales were up 13.6 percent. Twin Citizens have 14,126 properties to choose from – or 5.8 percent fewer than last November.

The market-wide median sales price held steady at $195,000 for a third straight month and up 13.4 percent compared to November 2012. Last year, foreclosures and short sales comprised 35.6 percent of all closed sales. In November 2013, these segments made up only 22.1 percent of all sales.

“We are seeing exactly what we want to be seeing,” said Andy Fazendin, President of the Minneapolis Area Association of REALTORS® (MAAR). “Lender-mediated activity once commanded heavy market share, and residential real estate is going to be stronger with fewer foreclosure and short sale properties in the system.”

Traditional new listings rose 11.1 percent, but foreclosure and short sale new listings fell 36.2 and 42.1 percent, respectively. Traditional closed sales rose 13.6 percent; foreclosure and short sale closings fell 34.7 and 57.6 percent. Traditional homes are selling at a median price of $217,000; foreclosures for $133,851; short sales for $150,000.

On average, homes are spending 75 days on the market – quite brisk relative to the past several years. Sellers are receiving an average of 95.4 percent of their original list price – the highest November ratio since 2005. The Twin Cities metro now has 3.2 months’ supply of inventory, which suggests sellers have regained their leverage.

“Some might claim that the recovery is stalling, but the reality is that job growth is gaining momentum and there are fewer distressed properties being listed and sold than at any point in the past five years.” said Emily Green, MAAR President-Elect. “We could stand to see this trend continue into 2014.”

Traditional Market Share Dominates as Sellers Re-enter the Scene

6a00e54ee9620b8834019b00fc7317970c-800wiMinneapolis, Minnesota (November 12, 2013) – The Minneapolis-St. Paul metropolitan housing market continued along the path toward recovery in October. While some measures suggest a slowing in the pace of recovery, this
deceleration is primarily the result of a healing distressed segment. Sellers felt more confident as new listings rose 15.1 percent to 6,102, marking the seventh consecutive year-over-year increase in monthly seller activity. Buyers
closed on 4,495 homes, a modest 1.9 percent increase over last October. Consumers have 15,556 properties from which to choose – or just 3.7 percent fewer than last October, but 19.2 percent more than in January 2013.

The market-wide median sales price was unchanged from September 2013 at $195,000, but was up 11.4 percent compared to October 2012. In October 2011, foreclosures and short sales together comprised 46.2 percent of all closed
sales. In October 2013, these two segments made up only 21.5 percent of all sales. For new listings, the same October figure dropped from 42.4 percent in 2011 to 19.5 percent of all new listings in 2013.

“The slight decrease in pending sales activity is entirely attributable to declines in the number of contracts signed on foreclosure and short sale properties,” said Andy Fazendin, President of the Minneapolis Area Association
of REALTORS® (MAAR).

Traditional pending sales activity was up 19.7 percent while foreclosure and short sale contracts were down about 33.7 and 50.8 percent, respectively. Closed sales increased 1.9 percent overall, but traditional closed sales rose 23.6
percent. Foreclosure sales and short sales were down 32.9 and 50.0 percent, respectively. New listings rose 15.1 percent overall, but traditional seller activity increased 39.0 percent higher as foreclosure and short sale new
listings fell 24.4 and 50.1 percent, respectively.

On average, homes are spending 75 days on the market – the quickest October pace in seven years. Sellers are receiving an average of 95.8 percent of their original list price – the highest October ratio since 2006. The Twin Cities
metro now has 3.5 months’ supply of inventory, which suggests sellers are regaining their leverage.

“We are within the final phases of market recovery,” said Emily Green, MAAR President-Elect. “Supply levels are stabilizing and regenerating, which means buyers have more choices and balance is being restored.”

All information is according to the Minneapolis Area Association of REALTORS® (MAAR) based on data from NorthstarMLS. MAAR is the leading regional advocate and provider of information services and research on the real estate industry for brokers, real estate professionals and the public. MAAR serves the Twin Cities 13-county metro area and western Wisconsin. 10K Research and Marketing, LLC is a wholly owned subsidiary of MAAR.

Home Prices Continue Their Ascent as Inventory Searches for Bottom

6a00e54ee9620b8834019affeaee89970d-800wi
Recovery continued across the Minneapolis-St. Paul metropolitan housing market even with our first taste of fall weather. Sellers regained some enthusiasm as new listings rose 19.3 percent to 6,372, marking the sixth consecutive year-over-year increase in monthly seller activity.

Buyers closed on 4,667 homes, a 14.5 percent increase over last September. Consumers have 15,968 properties from which to choose – 7.1 percent fewer than September 2012 but 22.5 percent more than in January 2013.

The overall median sales price stood at $195,000, up 11.7 percent compared to September 2012. Three factors have coalesced to attain higher sales prices: less supply, more demand and a sales mix that’s returning to traditional sales and away from foreclosures.

In September 2011, foreclosures and short sales together comprised 46.1 percent of all closed sales. In September 2013, these two segments made up only 21.9 percent of sales.

“Median sales prices have increased for 19 consecutive months in year-over-year comparisons,” said Andy Fazendin, President of the Minneapolis Area Association of REALTORS® (MAAR). “Rising rents, affordable prices and low interest rates continue to drive sales increases.”

While closed sales were up 14.5 percent overall, traditional buyer activity was up 37.3 percent. Foreclosure sales and short sales were down 27.3 and 30.0 percent, respectively.

Similarly, new listings were up 19.3 percent overall, but traditional seller activity rallied 42.6 percent higher as foreclosure and short sale new listings fell 29.6 and 42.6 percent, respectively.

Homes are selling in an average of 71 days, continuing a low-number trend from last month that we haven’t seen around here for more than six years. Sellers are receiving an average of 96.5 percent of their original list price – the highest September ratio since 2005. The Twin Cities is at 3.6 months’ supply of inventory for September 2013.

The traditional median sales price rose 4.4 percent to $217,000; the foreclosure median sales price was up 8.0 percent to $134,900; the short sale median sales price increased 10.9 percent to $145,250.

“With price gains continuing and multiple-offer situations still common, market recovery and stability has been the order of the day,” said Emily Green, MAAR President-Elect. “Activity should begin its season slowdown, but we expect year-over-year activity to remain positive.”

Foreclosure and Short Sales at Lowest Level Since 2007

6a00e54ee9620b8834019aff58559a970d-800wiTwin Cities home buyers were unflustered by slightly higher interest rates in August as pending sales were up 10.9 percent to 5,244. Along with rising prices, increased sales activity is fueling housing demand, while buyers continue to watch inventory levels for more options.

New listings rose 16.5 percent to 6,951, marking the fifth consecutive year-over-year increase in seller activity. Buyers have 15,773 properties from which to choose – 9.9 percent fewer than August 2012 but 21.2 percent more than in January 2013.

The overall median sales price was $208,000, up 16.9 percent compared to August 2012. A shift in sales type is driving this price growth. At this time last year, foreclosures and short sales together comprised 35.8 percent of all sales activity. In August 2013, these two distressed segments made up just 20.7 percent of all sales. On the seller side, the percentage of all new listings that were distressed in August fell to 17.8 percent, down from 32.7 percent in 2012.

While closed sales were up 8.9 percent overall, traditional buyer activity was up 34.7 percent. Foreclosure sales and short sales were down 34.5 and 43.5 percent, respectively. Similarly, new listings were up 16.5 percent overall, but traditional seller activity rocketed 42.1 percent higher. Foreclosure new listings fell 31.4 percent and short sale new listings fell 46.0 percent. With 18 straight months of year-over-year median price gains, multiple-offer situations still common and 3.6 months’ supply of inventory, few thought that the pendulum would swing this far this fast. Homes are selling in an average of 70 days – the quickest pace in six and a half years. Sellers are receiving an average of 97.0 percent of their original list price – the highest ratio in approximately seven years.

The traditional median sales price rose 3.7 percent to $228,000; the foreclosure median sales price was up 14.1 percent to $140,400; the short sale median sales price increased 13.4 percent to $142,608. On average, traditional homes sold in 62 days for 97.2 percent of original list price, foreclosures sold in 79 days for 97.1 percent of original list price and short sales lagged at 163 days and 94.2 percent of original list price.

Traditional (Non-Bank) Activity Driving the Housing Market Up

6a00e54ee9620b88340192ac7fffe5970d-800wi
The Twin Cities were once again buzzing with housing activity in July. Rising rents combined with still-favorable prices and mortgage rates have resulted in ongoing housing recovery. House hunters continue to eye seller activity for hints of additional inventory. New listings rose a healthy 24.6 percent, the second-largest gain since April 2010. Buyers have 15,671 properties from which to choose – 13.0 percent fewer than in July 2012 but still marking the smallest year-over-year decline in inventory in more than two years.

The overall median sales price was $208,757, up 17.2 percent compared to July 2012. A shift in sales type is driving this price growth. As recently as July 2011, foreclosures and short sales together comprised 45.4 percent of all sales activity. In July 2013, these two distressed segments made up just 20.6 percent of all sales. On the seller side, the percentage of all new listings that were distressed in July fell to 17.9 percent, down from 41.2 percent in July 2011.

New listings were up 24.6 percent overall, but traditional seller activity surged 55.7 percent – the most in nearly ten years. Foreclosure new listings decreased 31.2 percent and short sale new listings fell 42.1 percent. With 17 straight months of year-over-year median price gains, multiple-offer situations and just 3.6 months’ supply of inventory, the same market that recently favored buyers is now tilting toward sellers. Homes are selling in an average of 72 days – the quickest pace in six and a half years. Sellers are receiving an average of 97.5 percent of their original list price – the highest ratio in just over seven years.

The traditional median sales price rose 3.6 percent to $224,900; the foreclosure median sales price was up 11.6 percent to $135,000; the short sale median sales price increased 18.6 percent to $153,000. On average, traditional homes sold in 62 days for 97.6 percent of original list price, foreclosures sold in 83 days for 98.3 percent of original list price and short sales lagged at 166 days and 93.8 percent of original list price.

Median Price Exceeds $200,000 – Highest Since 2007

6a00e54ee9620b88340191042e2072970c-800wi

In light of a 14.2 percent increase in pending sales, Twin Cities home buyers seem unphased by recent mortgage rate increases. Even with rates around 4.5 percent, the housing stock remains highly affordable by historical comparison. In 25 of the past 26 months, there have been year-over-year gains in pending sales; and the metric is currently at its highest level since June 2006. House hunters are watching seller activity for clues of additional inventory.New listings rose 20.0 percent, the second-largest gain since March 2010. Buyers have 15,193 properties from which to choose – 17.2 percent fewer than in June 2012 but 17.4 percent more than in January 2013.

The median sales price for the metro area rose 17.5 percent to $210,000. That’s the highest median sales price since December 2007. A shift in sales types is driving this price recovery. As recently as February 2011, foreclosures and short sales comprised 61.5 percent of all sales activity.

In June 2013, these two distressed segments together comprised just 21.7 percent of all sales. On the seller side, the percentage of all new listings that were distressed in June fell to 16.8 percent, its lowest level since September 2007.

Seller activity was up 20.0 percent overall, but traditional new listings surged 44.4 percent. Foreclosure new listings decreased 24.6 percent and short sale new listings fell 51.7 percent. With 16 straight months of year-over-year price gains, multiple-offer situations and just 3.5 months’ supply of inventory, the same market that recently favored buyers is now tilting toward sellers.

Looking at price movement by segment, the traditional median sales price rose 8.7 percent to $232,000; the foreclosure median sales price was up 16.9 percent to $145,000; the short sale median sales price increased 14.2 percent, also to $145,000.

On average, traditional homes sold in 68 days for 97.7 percent of original list price, foreclosures sold in 71 days for 98.2 percent of original list price and short sales lagged at 156 days and 93.0 percent of original list price.