March Pending Sales Soar by the Most Since 2011, Highest Since 2005

By Aubray Erhardt on Friday, April 10th, 2015

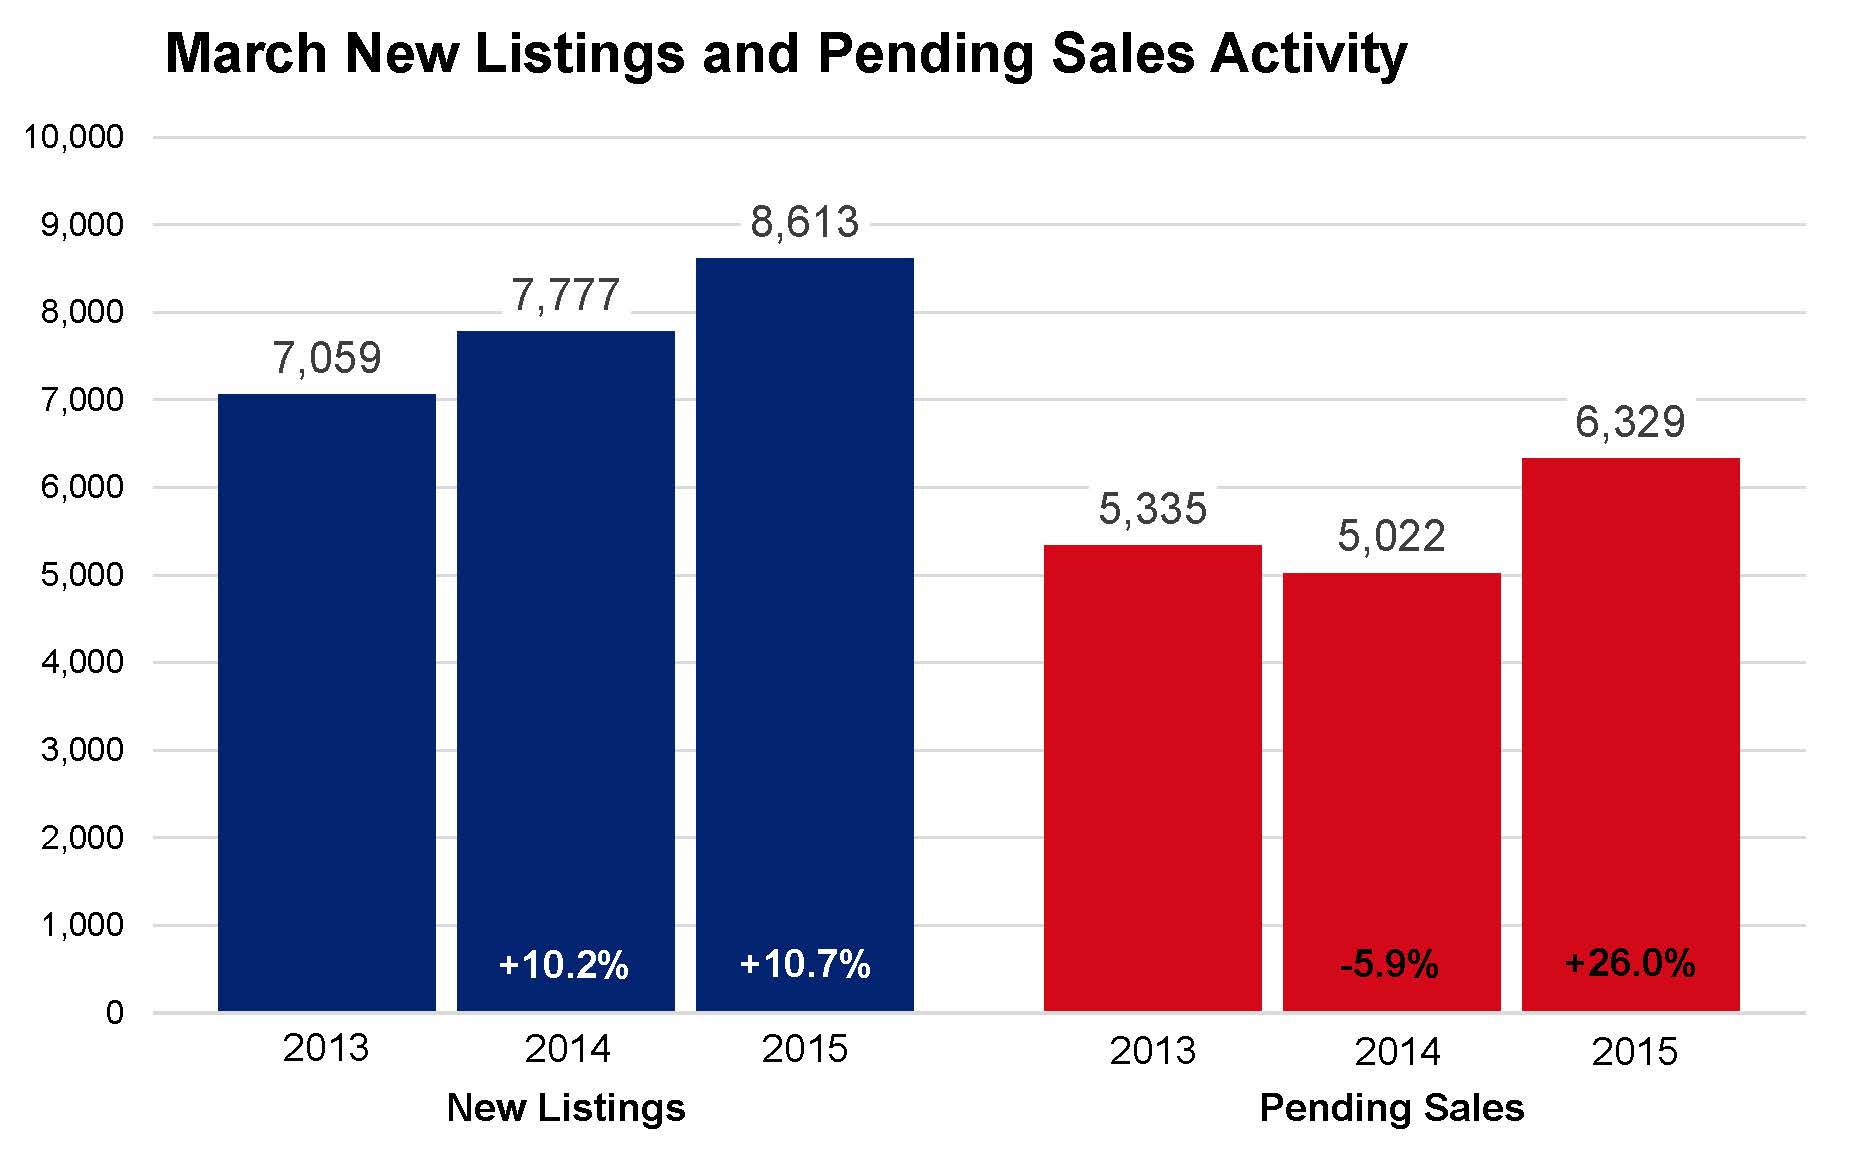
The number of signed purchase agreements in the 13-county Twin Cities region surged by 30.0 percent to 5,301 contracts. Sellers were also confident, as new listings increased 21.4 percent to 7,887 during the month. That is the largest increase in pending sales since August 2011 and the highest March count since 2005. New listings showed the second largest increase since July 2013 and the highest March count since 2010. Inventory levels rose 0.7 percent to 14,127 homes, the second increase this year.

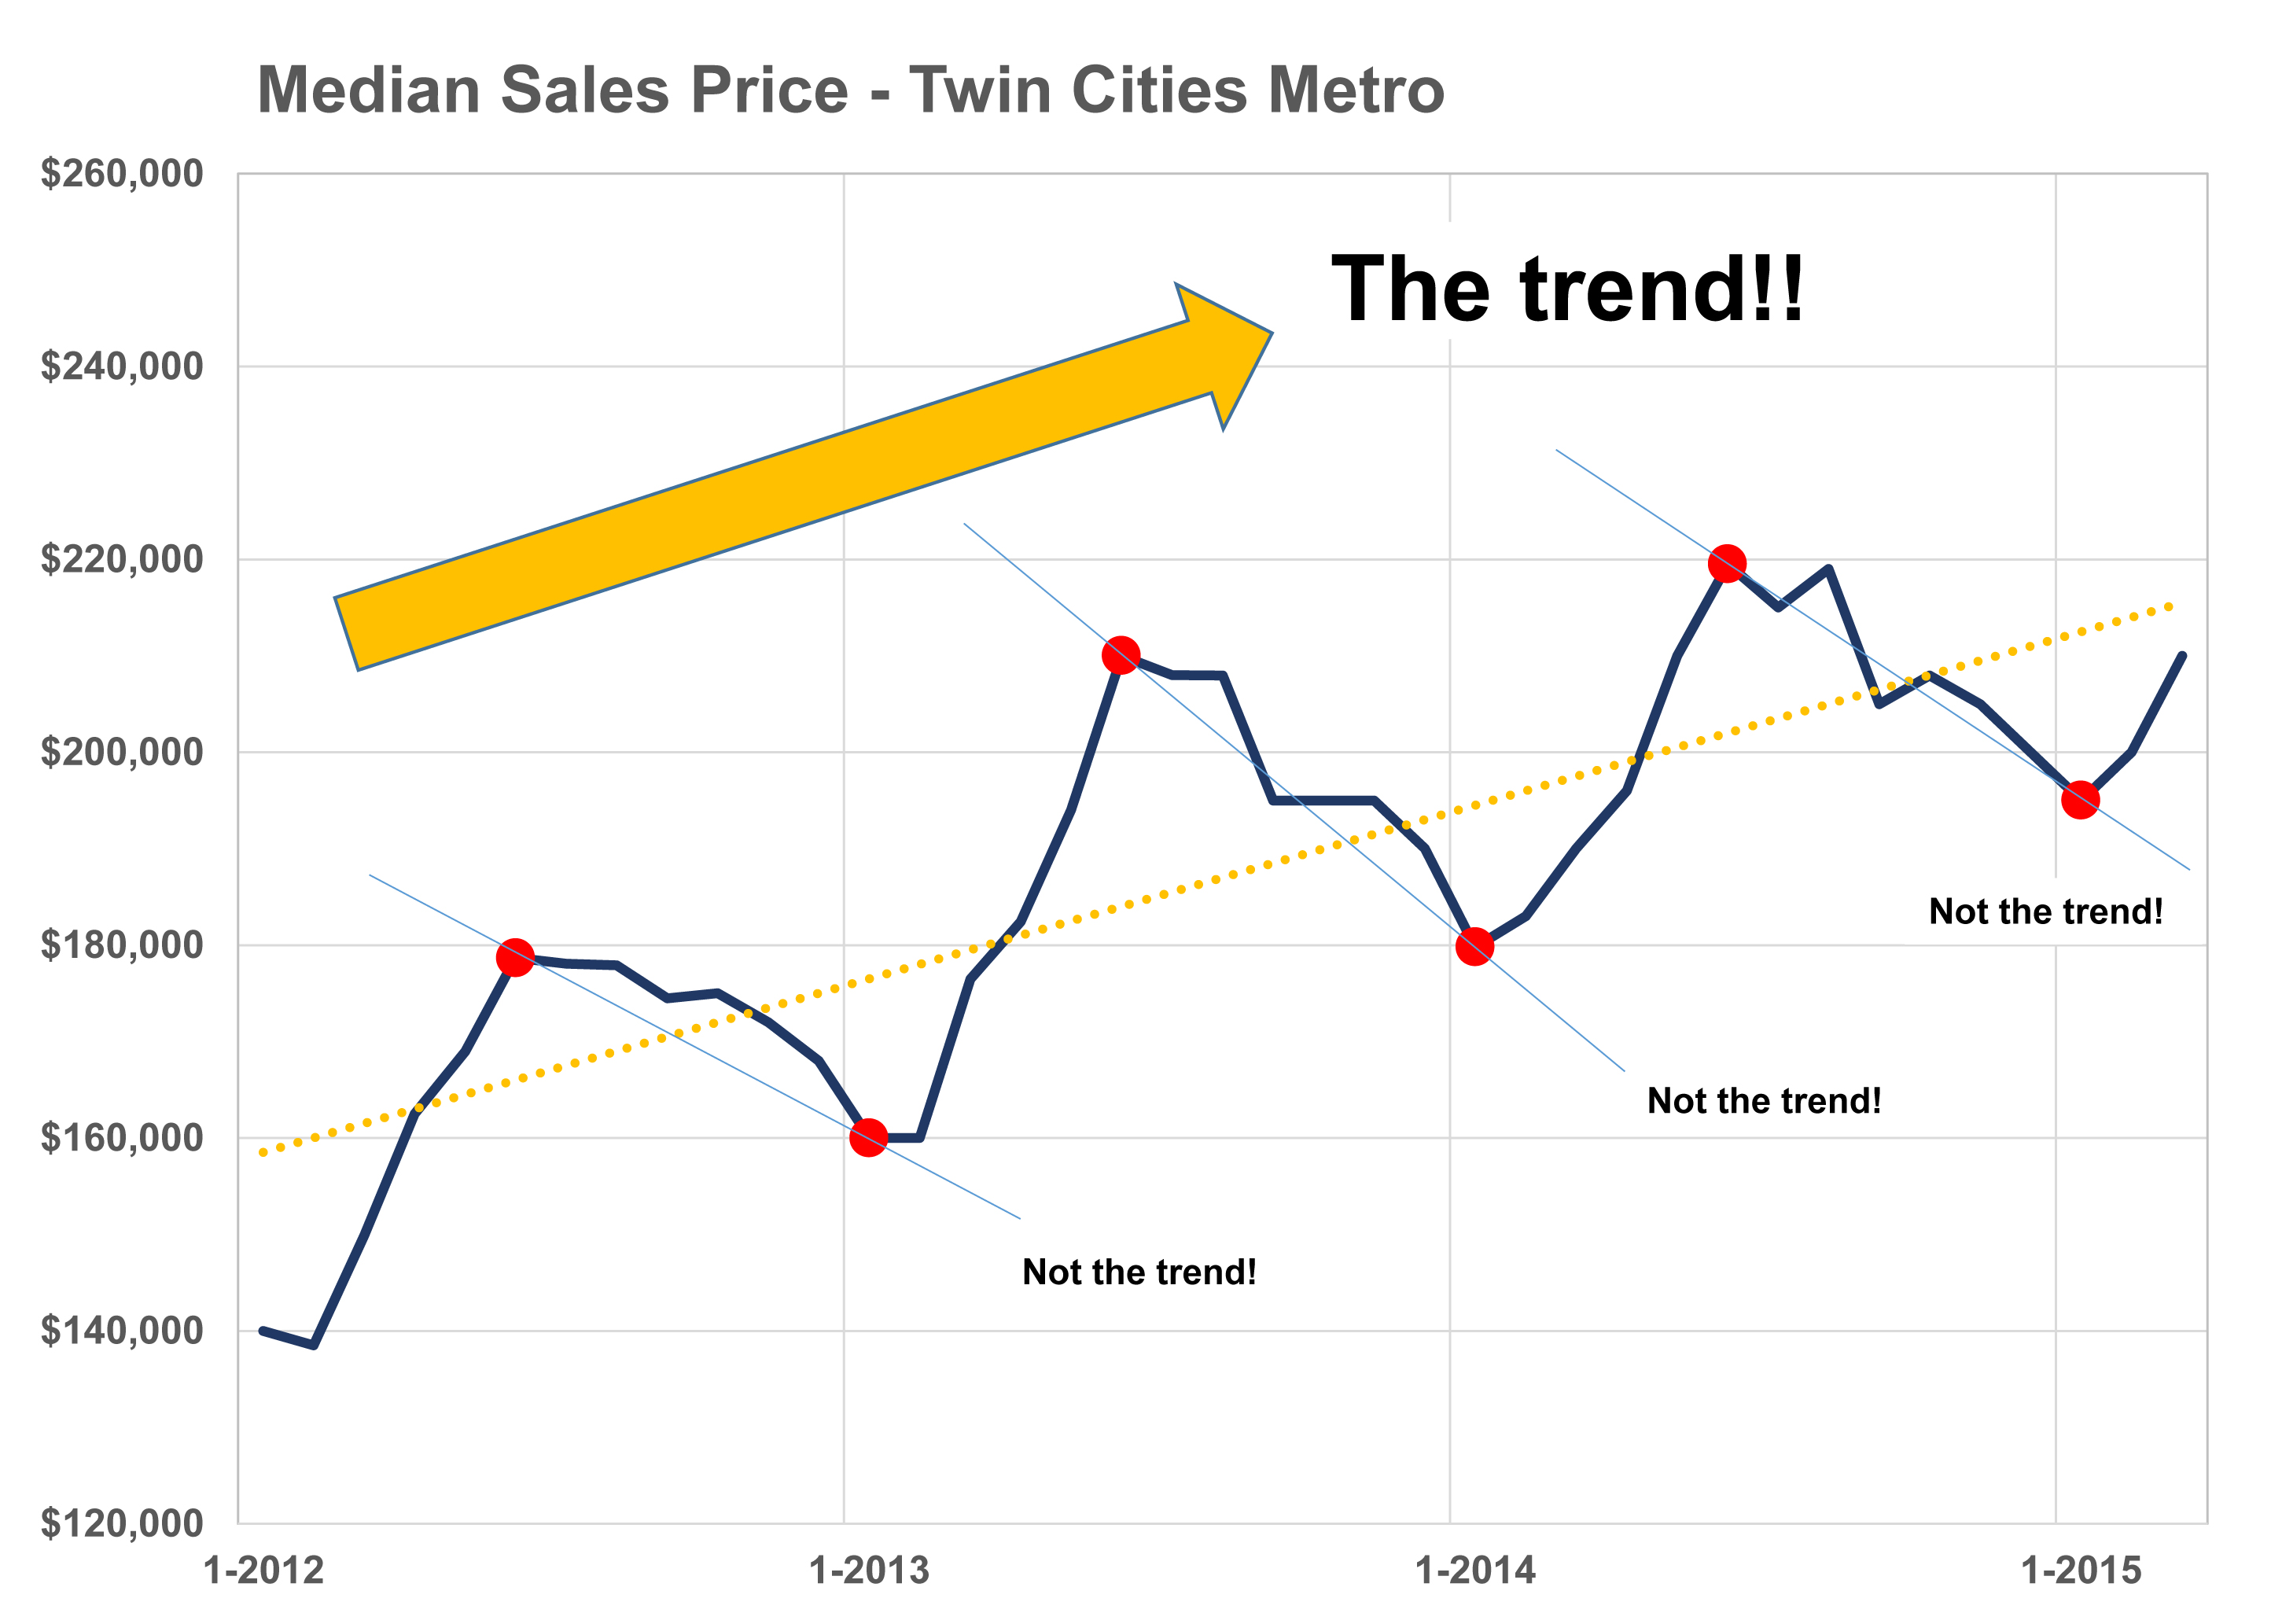
The median sales price rallied 10.5 percent higher to $210,000, the strongest gain in over a year. The median home price has now seen over 36 months of year-over-year increases. Price per square foot—which adjusts for the square footage of homes selling—rose a more modest 4.5 percent to $121. Absorption rates remained flat at 3.3 months, and suggest an overall sellers’ market. Days on market rose 7.4 percent to 102 days.

The role of foreclosures and short sales continued to diminish on both the list and buy sides. Traditional new listings comprised 92.2 percent of all seller activity, the highest level since October 2006. Traditional sales made up 84.9 percent of all closed sales, which is on-par with late-2007 levels.

The finance environment remains favorable. Mortgage rates continue to hover near multi-year lows at around 3.7 percent, compared with a long-term average of about 7.0 percent.

Improvements in the economy and household finances could partly offset the impact of rising prices and interest rates. The Twin Cities housing affordability index of 198 has been fairly stable since the end of 2014.

A diverse and robust regional economy has served the Twin Cities housing market well throughout various cycles. According to the Bureau of Labor Statistics, the Twin Cities has one of the lowest unemployment rates of any major metropolitan area in the nation at 4.0 percent.
From The Skinny Blog.

2015 Foreclosure & Short Sale Update

By David Arbit on Friday, March 20th, 2015

As many have noted, one of the biggest changes to the Twin Cities and national housing markets was the sudden influx and subsequent absorption of distressed properties. “Distressed” simply refers to any new listing, active listing or closed sale where the lender either owns the property (foreclosure) or the property was sold for less than the outstanding amount owed on the mortgage (short sale).

As both the public and private sectors began laying off workers in conjunction with other cost-cutting efforts around 2008 and 2009, many households begrudgingly became single-wage households or worse. That generated a notable increase in mortgage delinquencies, which led to banks repossessing homes and selling them short.

As financial institutions began listing these distressed homes for sale, buyers began taking advantage of the great deals. Many of those buyers were—and, to a lesser extent, are—investors, though some were ordinary families and individuals taking advantage of a historic opportunity.

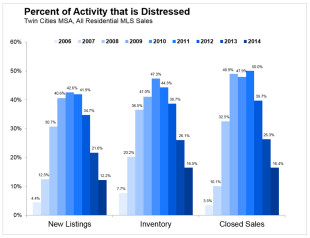
2015-03-20-14_51_47-Greenshot-310x238Due to a variety of factors ranging from rising home prices to the longest stretch of private job growth in decades, the share of market activity that can be categorized as either foreclosure or short sale is easing. In 2011, foreclosures and short sales together made up exactly 50.0% of all closed sales in the 13-county metropolitan area even though they comprised less than 42.0% of all new listings. This means they made up a larger share of the sales pie than the listing pie, signaling robust demand for these bargain properties.

Fast forward to 2014. Last year, only 12.2% of all new listings were in distress while the figure was 16.4% for closed sales. Those numbers mark a dramatic decrease in the prevalence of distressed listing and sales activity in the Twin Cities region. Most of the active listings (inventory) in this segment has been absorbed off the market and institutions are listing fewer and fewer of them.

So why should you care about any of this? Fair question. After all, foreclosure market share doesn’t exactly make for exciting backyard barbeque conversations, unless you’re a housing researcher (I swear I have friends that aren’t computers). But who doesn’t love talking about home prices? There never seems to be a shortage of speculation regarding where home prices might be heading next. Some think we’re in another bubble, others think we’re returning to historically typical levels of stable price appreciation.

Since prices seem to be the preferred market barometer of choice for most consumers (anyone heard of an absorption rate or even price per square foot?), it stands to reason that many consumers and real estate professionals alike would have a vested interest in better understanding what’s affecting home prices.

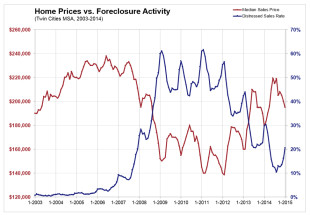
2015-03-20-14_50_07-Greenshot-310x215By far the biggest factor affecting home prices is the percentage of all sales that are distressed—i.e. the distressed sales rate. Coincidentally, that is exactly what’s shown in the blue trendline to the left. Also plotted here is the median sales price for the metro. This chart shows the nature and strength of the relationship between the distressed market share and home prices.

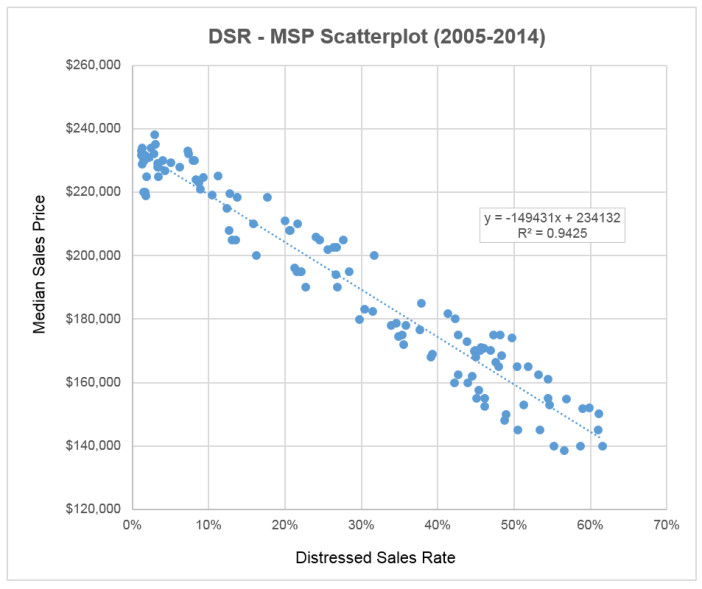
2015-03-20-14_37_11-Greenshot-702x589The nature of the relationship is an inverse one and the magnitude is quite strong. In other words, when distressed market share increases, home prices tend to fall and vice versa. And you can just about bet the farm on that one. For those who are wondering, the R-square between these two variables is 0.9425 and the relationship is statistically significant. This means that about 94.25% of the variation in home prices can be attributed to variability in distressed market share. If you had a 94.25% chance of success in betting big on a single stock or a poker hand or your favorite Canterbury horse, wouldn’t you?

Gazing into the proverbial crystal ball, expect distressed market activity to fall below 10.0% for closed sales and likely below 8.0% for new listings. But those are just prognostications. Ultimately, if you’re wondering where home prices are heading next, simply follow the percentage of all closed sales that are either foreclosures or short sales.

Wasn’t that fun? Until next time!

From The Skinny Blog.

After three full years of price gains, recovery shows renewed vigor

By Aubray Erhardt on Thursday, March 12th, 2015

The Twin Cities housing market showed refreshed signs of strength last month, partly in anticipation of what looks to be a promising spring market as well as favorable interest rates. Buyer and seller activity surged in February. New listings increased 23.2 percent to 5,690 during the month, the largest year-over-year increase since July 2013. Pending sales—or a count of the number of signed purchase agreements—increased 21.8 percent to 3,834, the largest year-over-year increase since October 2012. With only two months in the books, already buyers and sellers have shown more activity than they did for any one month of 2014. Inventory levels were still lower, down 2.0 percent to 12,700 homes, but that trend is unlikely to continue.

The median sales price rose 10.4 percent to $202,000, the strongest gain since last February. This increase officially marks 36 consecutive months or three full years of year-over-year median price gains. Price per square foot—which adjusts for the square footage of homes selling—rose 6.6 percent to $120. Absorption rates remained flat at 3.0 months, and still technically favor sellers. That said, today’s market environment is slightly less competitive than in 2013. Days on market rose 7.1 percent to 106 days.

The market share of foreclosures and short sales continued to shrink on both the supply and demand side. Traditional new listings rose a substantial 33.8 percent, while foreclosure and short sale new listings each fell between 25 and 30 percent. Traditional pending sales rose a massive 41.5 percent, while foreclosure and short sale pendings each fell between 32 and 36 percent. This dynamic has partly enabled three consecutive years of rising prices.

“If February is any indication, this spring is shaping up to be everything that spring markets should be,” said Mike Hoffman, President of the Minneapolis Area Association of REALTORS® (MAAR). “The fact that we’re seeing large gains in buyer and seller activity mostly driven by traditional properties bodes quite well for consumer confidence at a critical time.”

The finance environment remains enormously attractive. Mortgage rates continue to hover between 3.5 and 4.0 percent. The long-term average is roughly 7.0 percent. This appealing affordability picture can potentially offset recent home price increases and also encourages renters to consider homeownership. The Twin Cities housing affordability index of 210 has actually increased 2.4 percent from last February.

A highly diverse and robust economy has served the Twin Cities housing market well throughout various cycles. According to the Bureau of Labor Statistics, the Twin Cities has the lowest unemployment rate of any major metro in the nation at 3.3 percent. Recently, national private job creation has accelerated toward 300,000 jobs per month.

“Even though every area and market segment is unique, what we’re seeing in the numbers is definitely reflected out in the community,” said Judy Shields, MAAR President-Elect. “After being cooped up all winter, people are eager to get out there and find their dream home.”

From The Skinny Blog.

Strong Start to Year Sets Tone for 2015

By Aubray Erhardt on Thursday, February 12th, 2015

The Twin Cities regional housing market started 2015 on an enthusiastic but not overly dramatic note. Both seller activity and pending buyer activity increased relative to January 2014. Sellers introduced 4,497 new listings to the marketplace, 5.9 percent more than last year. Buyers entered into 2,986 purchase agreements, 7.8 percent higher than the pending sales count at this time last year. Inventory levels were lower, down 6.3 percent to 11,926 homes currently on the market. Many in the industry are expecting more inventory as we approach the spring market—both in a month-to-month sense as well as year-over-year.

The median sales price rose 8.5 percent to $195,000, the strongest gain since last February. This increase marks 35 consecutive months of year-over-year median price gains. Price per square foot—perhaps a more telling figure—rose 6.6 percent to $118. Absorption rates were dead-even with last January. Months supply of inventory was flat at 2.9 and still suggests the arc of the market is bending toward sellers. That said, today’s landscape is slightly less competitive than in past months. Partly as a result, days on market until sale rose 7.5 percent to 100 days.

Digging deeper, the trend of less foreclosure and short sale activity continued. Traditional pending sales rose a significant 21.9 percent, while foreclosure and short sale pending sales each fell about 25 percent. That changing mix of product has helped catalyze the nearly three straight years of price gains seen in the region.

“Both buyers and sellers appear confident and energized and the traditional segment enjoyed a strong start to the year,” said Mike Hoffman, President of the Minneapolis Area Association of REALTORS® (MAAR). “The steady, ongoing improvement and normalization we saw in January could be indicative of the year as a whole but only time will tell.”

Surprisingly, interest rates have again sunk below the 4.0 percent mark. Historically and persistently low mortgage rates tend to spur purchase demand. This highly attractive financing environment can potentially offset home price increases and also encourages renters to consider homeownership. The Twin Cities housing affordability index of 206 remained stable. This means that the median household income was 106 percent higher than the necessary income needed to qualify for the median-priced home under current interest rates.

Another factor motivating home buyers is the dramatically improving jobs scene—both locally and nationally. In December, the Bureau of Labor Statistics reported that the Twin Cities again had the lowest unemployment rate of any major metro in the nation at 3.3 percent. At 5.6 percent, the national rate is the lowest it’s been since June 2008. Private job creation is accelerating and figures from past months have been revised upward.

“Consumers seem excited about the upcoming spring market,” said Judy Shields, MAAR President-Elect. “Weather permitting, we’re expecting a strong turnout for both buyers and sellers. It should be an exciting year!”

From The Skinny Blog.

Year End Real Estate Stats

By Aubray Erhardt on Wednesday, January 14th, 2015

2014 Annual Wrap-Up: Recovery Continues, Market Normalizing.

Minneapolis, Minnesota (January 14, 2015) – Strong demand and higher prices were some of the positive developments seen in 2014. Market recovery continued to take hold. Sellers were motivated by rising prices and quick market times, and so they listed more properties for sale. Closed sales activity ended the year at the second highest level since 2005. Even though the active supply of homes for sale fell to a 12-year low, home buyers had more choices during the critical spring and summer selling season. Homes sold in less time, which was great news for sellers. Absorption rates were flat and still slightly favored sellers but 2015 should see more balance. Foreclosure activity fell for a third straight year, while new construction and condo activity continued to soar in and around downtown.

2014 by the Numbers

• Sellers listed 73,768 properties on the market, a 2.3 percent increase from 2013 and the highest level since 2010
• Buyers closed on 49,541 homes, down 6.9 percent from 2013 yet the second highest figure since 2005
• Inventory levels for December fell 7.2 percent from 2013 to 11,822 units, the lowest level in 12 years but May 2014 inventory was 13.4 percent higher than May 2013.
• Months Supply of Inventory was flat at 2.9 months, tied for a 12-year low
• The Median Sales Price rose 7.2 percent to $205,739, marking a seven-year high
o This measure of home prices is 11.8 percent below its 2006 peak and 37.2 percent above its 2011 valley
• Cumulative Days on Market was down 6.0 percent to 78 days, on average—an eight-year record pace
• Lender-mediated properties made up a significantly smaller share of overall activity across multiple metrics
o 12.2 percent of all New Listings were lender-mediated (either foreclosures or short sales), down from 21.6 percent in 2013 and 34.7 percent in 2012
o 16.4 percent of all Inventory was lender-mediated, down from 26.1 percent in 2013 and 38.7 percent in 2012
o 16.5 percent of all Closed Sales were lender-mediated, down from 26.3 percent in 2013 and 39.7 percent in 2012
From The Skinny Blog.

Recovery Plows Forward as New Condo Prices Reach Fresh Highs

The Twin Cities regional housing market continued to make strides toward recovery in November, even as some measures appear to show unfavorable movement. Pending sales, or the number of signed purchase agreements, fell 7.5 percent in November compared to last year. New listings decreased 12.8 percent. Inventory levels were nearly flat, down 1.0 percent to 14,948 homes.

The median sales price rose 5.1 percent to $205,000, marking 33 consecutive months of year-over-year median price gains. Price per square foot rose 3.4 percent to $120 while months supply of inventory increased 5.9 percent to 3.6. Days on market until sale rose 5.3 percent to 79.

As has reliably been the case for years, pending purchase activity of traditional homes rose even while the overall pending sales indicator declined, signaling the ongoing shift from distressed properties back to the once-again dominant traditional sector. That changing mix of sales activity has helped catalyze the nearly three straight years of price gains seen in the region.

Another factor boosting prices is newly constructed condominiums, particularly in downtown Minneapolis. There’s a building boom happening downtown, even after factoring out the construction and surrounding redevelopment of the new stadium for the Minnesota Vikings.

The median price of new construction condominium sales rose 65.2 percent in November to a new high of $366,242. Although that’s for the entire Twin Cities area, downtown new construction condos comprised about 30.0 percent of all similar units in the Twin Cities in November 2006 but made up about 60.0 percent of that segment in November 2014.

Despite the shiny marvel of new downtown development, the overall housing stock in the Twin Cities region remains quite affordable historically. The Twin Cities housing affordability index of 191 means that the median household income was 91 percent higher than the necessary income needed to qualify for the median-priced home under current interest rates.

In October, the Bureau of Labor Statistics stated that the Twin Cities had the lowest rate of unemployment among major metros in the nation at 3.2 percent. The national rate, at 5.8 percent, is the lowest since July 2008. With national private job creation reaching above 300,000 new payrolls in November, the overall jobs picture is bright.

Gains in Traditional Activity

In October 2014, overall buyer and seller activity both cooled slightly in the 13-county Minneapolis–St. Paul metropolitan area. Pending sales declined 1.3 percent from last year, while new listings decreased 2.3 percent.

Gains in traditional activity nearly offset dramatic declines in the foreclosure and short sale arena. Inventory levels rose 4.3 percent to 17,132 homes, providing buyers with more options. The median sales price rose 7.2 percent to $209,000, marking 32 consecutive months of year-over-year median price gains. Price per square foot rose 5.6 percent to $123.

The amount of time a home spends on the market fell 4.0 percent to 72 days, on average. Months’ supply of inventory rose 10.8 percent to 4.1 months, suggesting that the market is moving back toward balance after favoring sellers. The sales mix continued to skew toward traditional homes that sell in less time and at higher price points.

Despite an overall 2.3 percent decrease in seller activity, traditional new listings rose 6.7 percent while foreclosure and short sale new listings were down 42.4 and 31.3 percent, respectively. Similarly, overall closed sales were down 1.5 percent, but traditional closed sales rose 9.7 percent while foreclosure and short sale closings fell 41.1 and 48.3 percent. Market-wide inventory levels increased 4.3 percent, but traditional inventory was up 17.9 percent while foreclosure and short sale inventory levels declined 39.0 and 43.5 percent.

The Twin Cities housing affordability index of 188 means that the median household income was 88 percent higher than what’s necessary to qualify for the median-priced home given current interest rates. While the index is below its 2012 peak, it remains above its long-term average.

According to the Bureau of Labor Statistics, the Twin Cities has the lowest unemployment rate among major metros in the nation at about 3.8 percent. The national rate recently dropped below 6.0 percent for the first time since 2008.

From The Skinny Blog.

Price Gains Normalizing as Traditional Sellers Replenish Inventory

For the month of September 2014, inventory in the 13-county Minneapolis–St. Paul metropolitan area rose 8.2 percent from last year, and it was the seventh month in a row of year-over-year inventory gains. Consumers now have 18,250 homes from which to choose. Sellers were more motivated to sell this year, as evidenced by new listing activity increasing 7.2 percent to 6,832. Top-line pending sales decreased a slight 1.3 percent to 4,155, indicative of there being less foreclosure activity entering the market than anything else.

With 4.4 months’ supply of inventory, the absorption rate is consistent with a market transitioning back toward balanced territory, where neither buyers nor sellers have a clear edge. The sales mix continued to skew toward traditional homes that sell in less time and at higher price points. The median sales price rose 5.1 percent to $205,000. That now marks 31 consecutive months of year-over-year price gains.

Prices are driven by several factors such as supply and demand but also changes in the sales mix. Looking more deeply at the numbers, a story emerges. While new listings rose 7.2 percent overall, traditional new listings were up 17.9 percent while foreclosure and short sale new listings fell 42.2 and 42.5 percent, respectively. Similarly, overall pending sales were down 1.3 percent, but traditional pending sales rose 9.2 percent while foreclosure and short sale pendings fell 37.0 and 43.3 percent. Market-wide inventory levels increased 8.2 percent, but traditional inventory was up 23.2 percent while foreclosure and short sale inventory levels fell 38.2 and 47.1 percent.

Despite nearly three straight years of rising prices, the Twin Cities housing affordability index has remained relatively stable. The current reading of 186 indicates that the median household income was 86 percent greater than what’s necessary to qualify for the median-priced home under current interest rates. While the index is below its 2012 peak, it remains above its long-term average.

Buyers have more homes from which to choose than they had at any point in 2013 and half of 2012. A growing share of that inventory falls into the traditional segment. Days on market was perfectly even with last year at 71 days. The median list price rose 6.7 percent to $239,900. Price per square foot rose 4.7 percent to $121.

According to the Bureau of Labor Statistics, the Twin Cities currently has the lowest unemployment rate among major metros in the nation at 3.8 percent. The national rate dropped below 6.0 percent for the first time since 2008.

Prices Maintain Near 7-Year High While Inventory Rises

By Aubray Erhardt on Thursday, September 11th, 2014

Inventory in the 13-county Minneapolis-St. Paul metropolitan area is up 8.7 percent from last year. August was only the sixth month of year-over-year inventory gains. Consumers now have 18,205 homes from which to choose. New listings were flat, increasing just 0.1 percent to 6,958, while market-wide pending sales decreased 7.0 percent to 4,802. Overall closed sales were down 7.3 percent from last year to 5,291 units.

With 4.4 months supply of inventory, the absorption rate is consistent with a transitioning market approaching balanced territory. Sellers are still seeing multiple offers on quality listings but buyers don’t have to compete quite as hard over limited supply. The sales mix continued to favor traditional homes that sell in less time and at higher price points. The median sales price rose 5.3 percent to $219,001. That’s the highest August median sales price since 2007, and the 30th consecutive year-over-year increase.

Prices hinge upon a variety of factors, including supply and demand but also changes in market share based on area or segment. While new listings rose only 0.1 percent overall, traditional new listings rallied 10.9 percent higher while foreclosure and short sale new listings fell 49.3 percent and 46.6 percent, respectively. Similarly, overall closed sales were down 7.3 percent, but traditional closed sales rose 4.6 percent while foreclosure and short sale closings fell 50.4 percent and 58.0 percent. Market-wide inventory levels increased 8.7 percent but traditional inventory surged 24.5 percent while foreclosure and short sale inventory levels both fell dramatically.

Contrary to most economists’ forecasts, interest rates remain lower than last year. That’s helped buyers take advantage of the attractive affordability environment. The Twin Cities housing affordability index was mostly flat, down just 1.1 percent from last August to 176 – meaning the median household income was 176 percent of what is necessary (or 76 percent greater than the minimum needed) to qualify for the median-priced home under current interest rates. While the affordability index is below its peak in 2012, it remains well above its long-term average.

Those shopping for homes now have the largest pool of traditional properties to choose from since mid-2010. A growing share of activity now falls into the more desirable traditional segment – 90.6 percent of new listings, 89.4 percent of closed sales and 88.0 percent of all inventory. Those are the highest figures since April 2007, August 2007 and July 2007, respectively. Days on market fell 2.9 percent to 68 days; the median list price rose 6.9 percent $235,000; and price per square foot rose 5.3 percent to $126.

Twin Cities Has Largest Pool of Homes for Sale in Almost a Year

House hunters in the 13-county Twin Cities metropolitan area are finally getting more to choose from. Inventory levels were up 6.1 percent to 16,368 homes for sale in May 2014. This comes as new listings were up 3.0 percent to 8,572 and pending sales were down 9.0 percent to 5,260. Even though overall buyer demand remains below 2013 levels, it’s still well above 2011 and 2012 levels. Moreover, buyer demand increased for traditional homes.

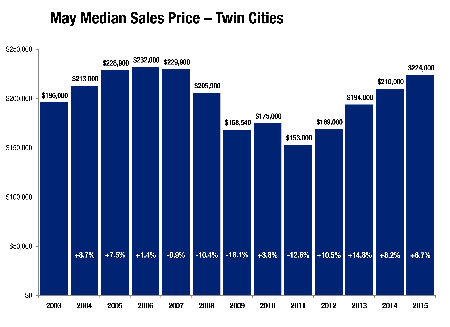
Absorption rates actually slowed to 3.9 months of supply, thanks to recent inventory increases. Even with more supply and less demand, the mix of sales continues to skew away from distressed properties and toward traditional homes that sell at higher price points. Consequently, the median sales price rose 8.2 percent to $210,000 – the highest May median sales price since 2007 and tied for the highest median price for any month since December 2007.

Though new listings rose 3.0 percent compared to last May, traditional new listings rose 14.1 percent while foreclosure and short sale new listings fell 44.0 percent and 47.7 percent, respectively. Similarly, though pending sales were down 9.0 percent, traditional pending sales rose 0.7 percent while foreclosure and short sale pendings fell 39.3 percent and 47.3 percent. And again, overall inventory was up 6.1 percent but traditional inventory was up 25.9 percent as foreclosure inventory fell 36.6 percent and short sale inventory plummeted by 53.6 percent.

With inventory up, consumers now have the largest pool of homes for sale in almost a year. Inventory hasn’t shown this many consecutive year-over-year increases in about 3½ years. Perhaps more importantly, a larger share of that inventory falls under the more desirable traditional segment.

“Yes there’s more inventory, but not in all areas or price points,” said Emily Green, President of the Minneapolis Area Association of REALTORS® (MAAR). “The lack of supply is really starting to weigh on consumers and on sales numbers. This market has been supply-constrained for long enough, but the trend is moving in a positive direction.”

As a result of this ongoing shift toward higher-priced and higher-quality product, the median sales price for the metro rose 8.2 percent to $210,000. That now makes 27 straight months of year-over-year price gains. Also helping along price recovery is the fact that foreclosures and short sales made up only about 10.0 percent of all new listings and about 15.0 percent of all closed sales. Those are the lowest figures since October 2007 and May 2007, respectively.

Homes continued to sell quickly, as days on market was down 7.0 percent to 80 days, on average. Sellers are receiving an average of 96.8 percent of their original list price. The Twin Cities now has 3.9 months’ supply of inventory, just a tad higher than last May and consistent with this phase of market recovery.

“More inventory really is a good sign,” said Mike Hoffman, MAAR President-Elect. “But housing relies heavily on the economy. That said, job growth, unemployment, consumer confidence and family financial situations must continue to show improvement.”