Twin Cities Housing Strong Heading into Fall

By Erin Milburn on Tuesday, October 13th, 2015

After an impressive summer, Twin Cities home sales continued at a 10-year record pace in September. Most indicators are beginning to show month-to-month moderation although year-over-year comparisons remain positive. The number of closed sales rose 12.0 percent to 5,114 homes. Fewer sellers listed their properties than last September, as new listings decreased 6.9 percent to 6,355. Inventory levels fell 16.0 percent to 15,928 active units. Prices continued to rise with the median sales price up 8.3 percent over last year.

Other price measures also continued to perform well. The median list price rose 2.1 percent to $245,000; while the average price per square foot rose 6.3 percent to $129. Sellers enjoyed their position of strength in the marketplace as the percent of original list price received at sale rose 1.0 percent to 96.6 percent. At 4,635 contracts signed, pending purchase activity also remains strong—12.3 percent above last September’s levels. On average, homes sold in less time. Days on market declined 8.5 percent to 65 days. This is consistent with a market leaning slightly towards sellers. Months supply of inventory fell a significant 26.1 percent to 3.4 months of supply. Generally, five to six months of supply is considered balanced. While the metro as a whole is favoring sellers, not all areas, segments and price points reflect that. Sept-Closed-Sales_2015-10
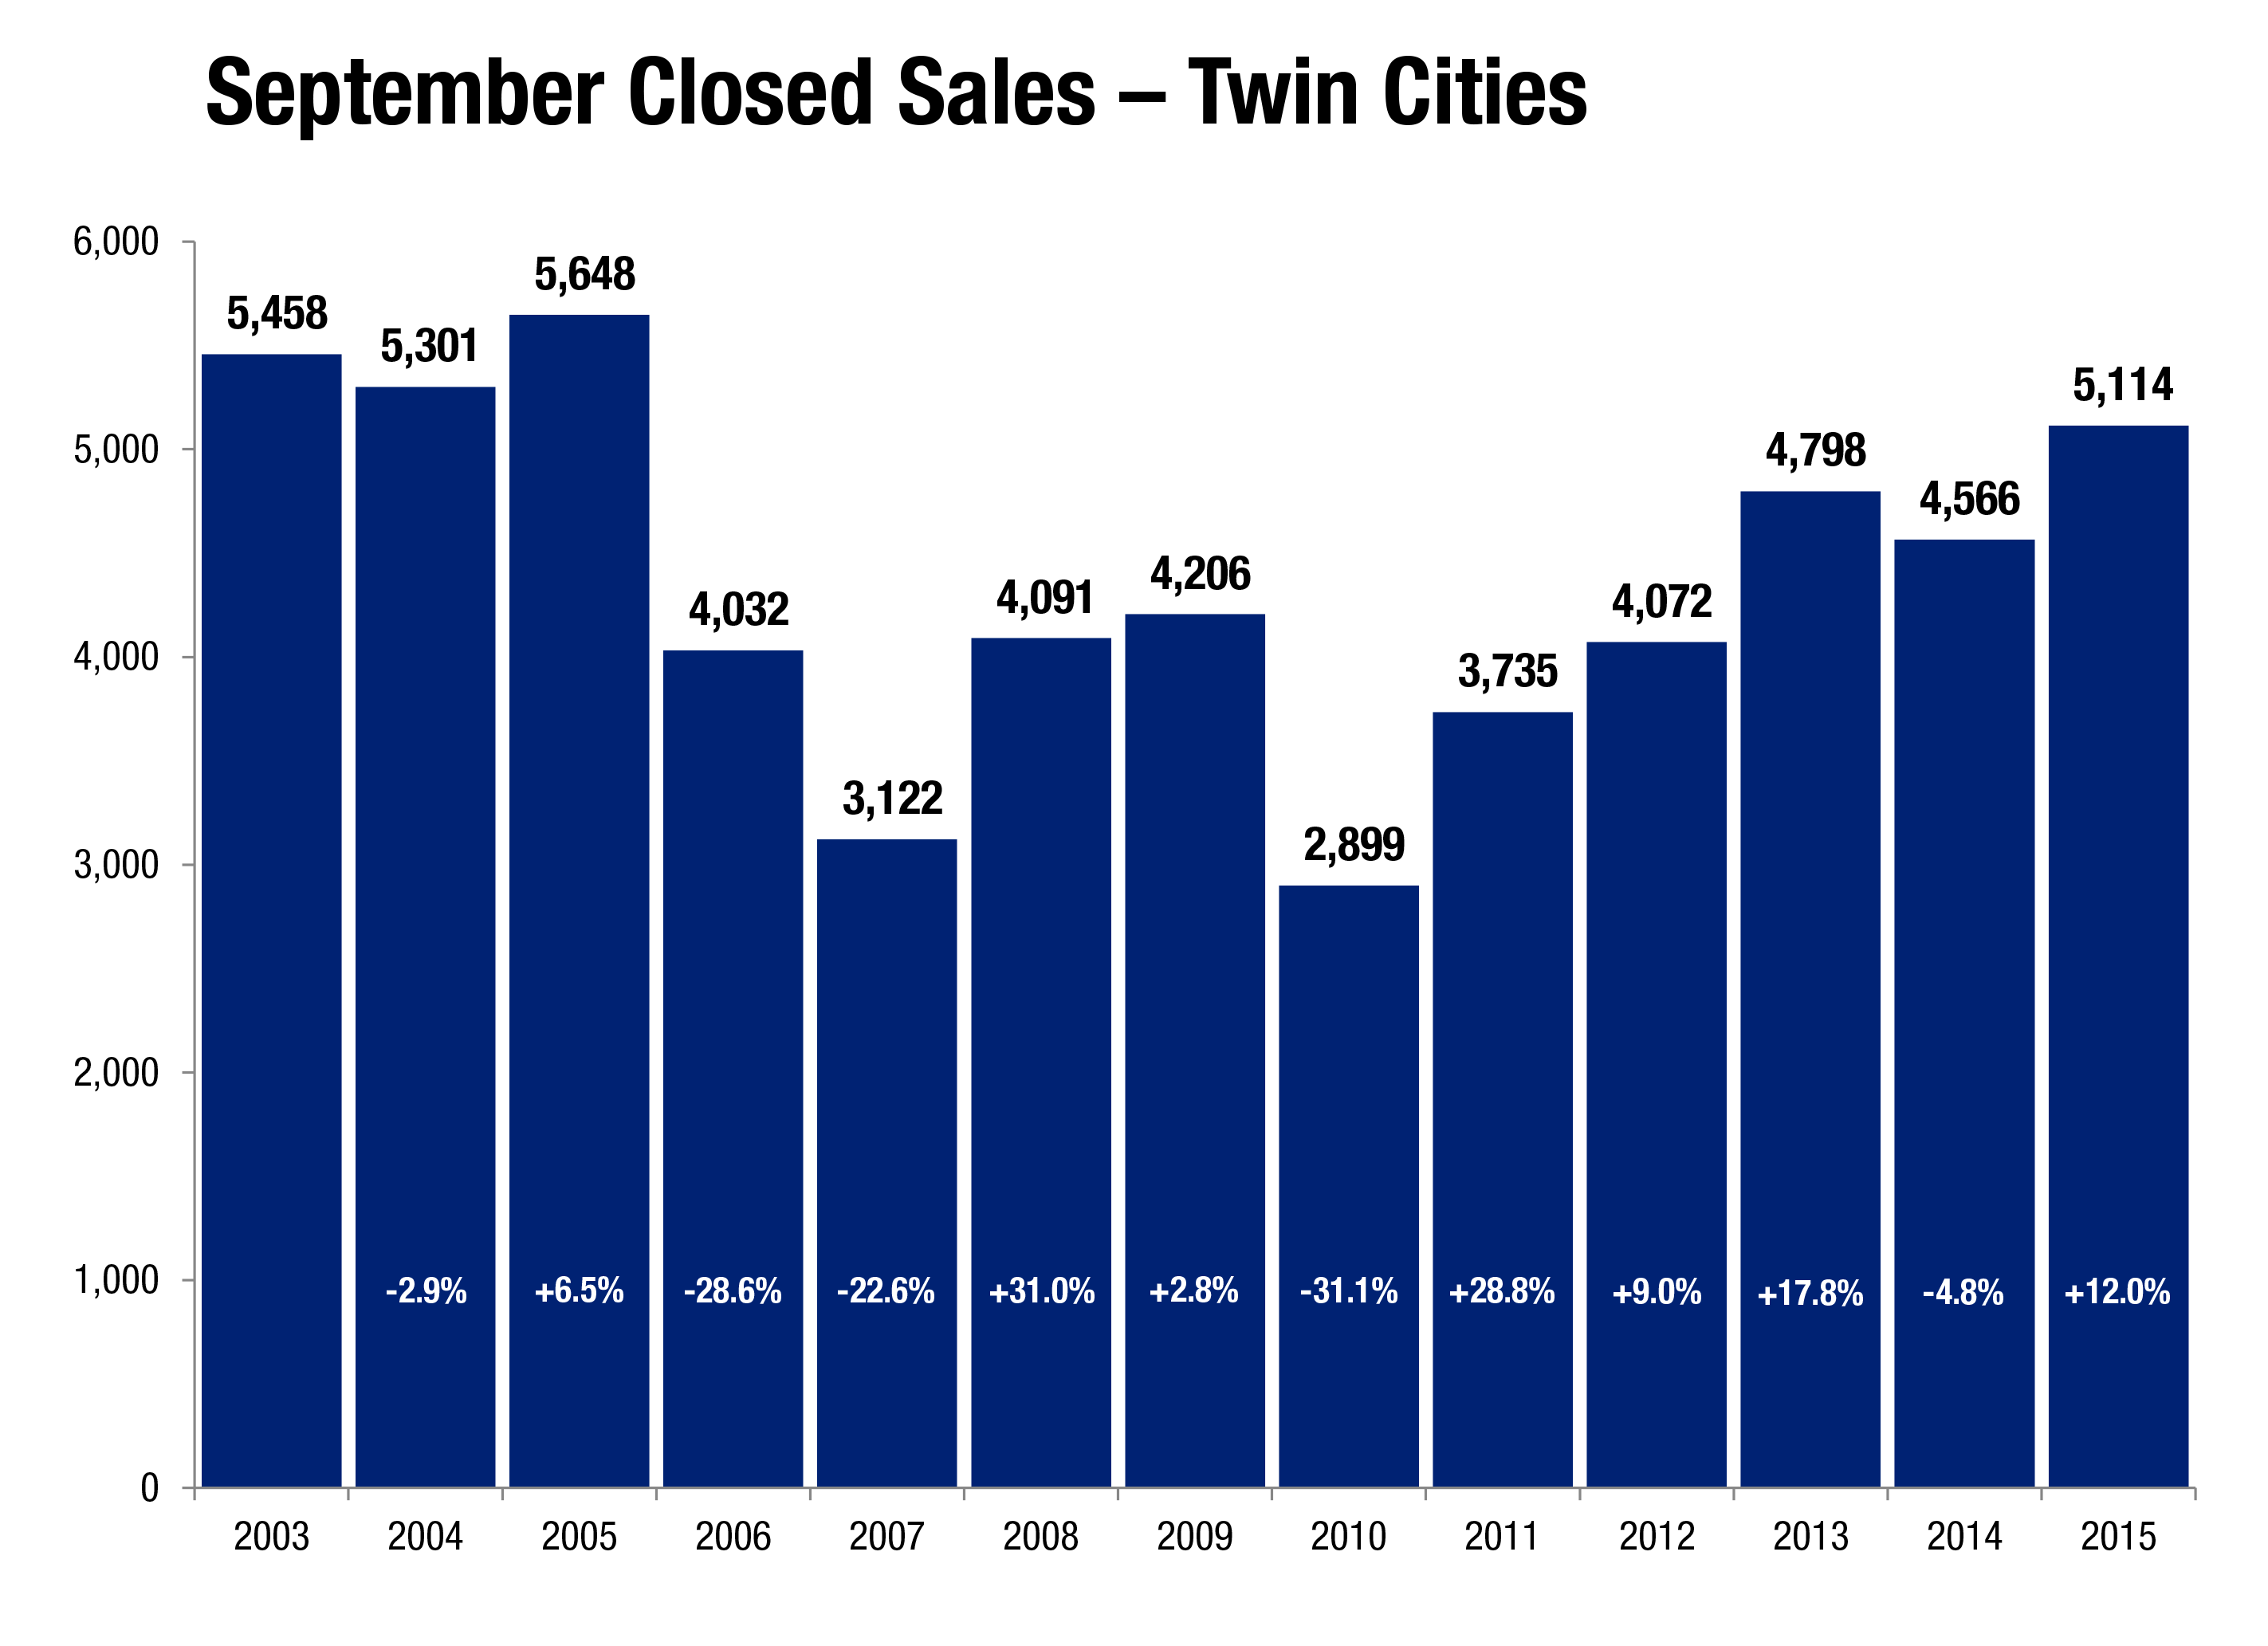
“September was another strong month for buyer activity,” said Mike Hoffman, Minneapolis Area Association of REALTORS® (MAAR) President. “Seller activity, however, remains restrained, meaning those who do choose to sell are getting top dollar in near-record time. The demand for homes is still exceeding the supply.”

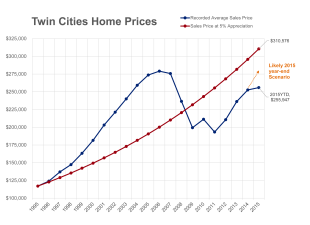
Strong demand and low supply levels have created an environment where competitively-priced homes sell quickly and sometimes with multiple offers. This supply-demand imbalance, along with the “product mix shift” back to traditional sales, also means prices have risen for 43 consecutive months. The September 2015 median sales price rose 8.3 percent to $222,000 compared to a year-to-date increase of 6.8 percent to $220,000. Sellers are accepting offers at a median of 99.2 percent of their final list price.

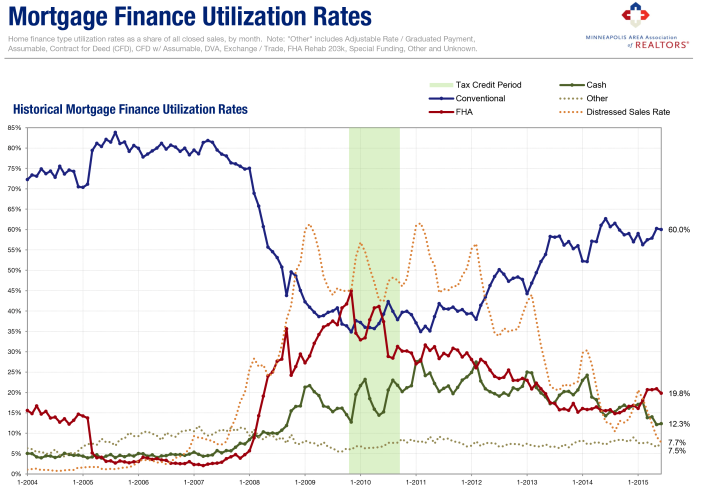
Since housing doesn’t occur in a vacuum, it depends on other economic forces like a recovering labor market, job growth, favorable interest rates and confident consumers. Those factors have helped support our recovering housing market. We’re in the midst of the longest stretch of private job growth on record, unemployment has been cut in half from its peak and consumer confidence is rising. The latest Bureau of Labor Statistics figures show the Minneapolis-St. Paul-Bloomington metropolitan area had the second lowest unemployment rate of any major metro at 3.3 percent compared to 5.1 percent nationally. Mortgage rates are around 4.0 percent, compared to a long-term average of over 7.0 percent. The Federal Reserve is committed to lifting their key Federal Funds rate, a major factor affecting mortgage rates.

“We expect interest rates to stay below their long-term average for years to come,” said Judy Shields, MAAR President-Elect. “The trick will be sustaining price gains that motivate enough sellers to list their properties without pricing out today’s buyers—particularly first timers.”
From The Skinny Blog.

The Inflatable Price Raft

By David Arbit on Tuesday, August 18th, 2015
InflatableRaftPrice_-01-702x327Screen shot 2015-08-20 at 12.51.28 PM

“Accept certain inalienable truths: Prices will rise. Politicians will philander. You, too, will get old. And when you do, you’ll fantasize that when you were young, prices were reasonable, politicians were noble and children respected their elders.” – Mary Schmich

We hear a lot about home prices and how they change over time. But by far the biggest pitfall of dealing in absolute dollar terms is that a dollar in 2015 does not buy what a dollar used to get you in 1960 or even in 2010. If you’ve ever purchased the same product or service even just several years apart, you implicitly know this, though you may not be familiar with some of the rationale and technical aspects of tracking and adjusting for inflation. And let’s be clear here: that is ok!

While the nominal (not inflation-adjusted) home price has certainly increased in absolute terms, the typical home that cost $15,977 in 1960 dollars would actually cost exactly $127,635 in 2014 dollars. So a lot of what appears to be price gains is actually attributable to inflation, though not all of it. This is why it’s important to separate out inflation-adjusted prices from nominal, reported prices. It’s the best way to answer the question: excluding the effect of inflation, how much did real home prices actually increase?

The Consumer Price Index (CPI) is the most common method to account for inflation when dealing with time-series data stated in currency units. Using the Bureau of Labor Statistics (BLS) CPI, we’ve adjusted historic home prices and restated them in constant 2014 dollars. Note how far apart the trendlines start versus where they end up. Only when nominal prices approach 2014 do the trendlines converge—since, at that point, both nominal and adjusted prices are stated in 2014 dollars.

Enough with the buildup. So what’s really going on here?

Between 1960 and 2015, nominal home prices increased from $15,977 to $261,963, a gain of 1,539.6 percent. During the same period, inflation-adjusted prices increased from $127,635 to the same $261,963 for a more modest gain of 105.2 percent. That’s a big difference, and shows just how much of the run-up in prices can be attributed to inflation.

But it’s also important to note that home prices more than doubled during the 54 year study period (1960-2014) even after adjusting for inflation and despite the downturn. That means after factoring for inflation, home prices kept pace with inflation AND doubled in 54 years. An increase of 105.2 percent spread out across 54 years translates into a 1.95 percent real annualized average growth rate. That finding supports the roughly 2.0 percent annual home price increase that is referenced quite often. It also supports the fact that real estate is an effective inflation hedge.

Equally or perhaps even more importantly, while nominal home prices are quickly nearing their 2006 highs, inflation-adjusted or real home prices are still well below their previous peak in 2005. In other words, while nominal prices seem to be approaching their previous peak, real home prices are still a bargain, especially compared to 2004-6 prices stated in 2014 dollars. That means real home prices have to increase 26.4 percent before they break even with 2005 levels. Nominal home prices have about 6.6 percent to go before reaching 2006 levels.

But life is all about choices, and choices—at least in the strict economic sense—represent a series of opportunity costs. An opportunity cost of a choice, such as buying a house, is what you give up to get it. Most of us have to choose between two major investments at any given time. Sure, gold and other precious metals might also keep pace with inflation and then some, but you can’t live in a pile of bullion. You can only visit your gold periodically. Investing in a home is one of the most effective inflation hedges out there. Plus, while you’re quietly slaying the inflation dragon and enjoying some appreciation, you’ve got a place to live!
Inflation-Chart1-702x506 From The Skinny Blog.

Housing Continues to Delight as Summer Activity Starts to “Cool”

By Erin Milburn on Thursday, August 13th, 2015

Minneapolis, Minnesota (August 13, 2015) – After purchase demand reached a 10-year record high in June, the Twin Cities metropolitan housing market continued to delight in July. With the spring and summer peak buying season coming to a close, activity levels should begin to cool month-to-month, though most indicators should continue to show year-over-year improvement. The number of signed purchase agreements rose 12.1 percent to 5,716 for July, but are up 18.7 percent so far in 2015. Closed sales increased 17.7 percent to 6,275, but have risen 16.7 percent so far this year. Seller activity was flat compared to last July, new listings fell just 0.4 percent from 7,997 to 7,963. Given that combination of supply and demand movement, the number of available properties for sale fell 11.0 percent to 16,940 homes.

08-12-2015_MAAR-PR-CS

“While those selling their home are yielding top dollar, others wonder if today’s younger generation will be renters forever,” said Mike Hoffman, Minneapolis Area Association of REALTORS® (MAAR) President. “But a National Association of REALTORS® (NAR) survey found that millennials comprised 32.0 percent of all home buyers and 68.0 percent of first-time buyers—both the largest share of any group.”

As interest rates continue to normalize this year, even more pent-up demand from all age brackets will likely be released during this period of historic affordability.

Since demand increased while supply indicators fell—and because a larger share of sales came from the higher-priced traditional segment—the July 2015 median sales price rallied another 4.7 percent to $225,000. The median price per square foot increased 3.4 percent to $120. While the July 2015 median sales price was slightly lower than the June 2015 price, the July 2015 price per square foot was slightly higher than June 2015.

Again due to the factors mentioned above combined with a sense of urgency among buyers, the number of days a property spent on the market fell 7.4 percent to 63 days. Sellers are accepting offers at a median of 98.5 percent of their original list price but 99.7 percent of their final list price, suggesting near-full price offers come quickly once a seller is priced right.

The Twin Cities metropolitan area has 3.7 months’ supply of inventory, which means the region as a whole is a seller’s market. That figure dropped 19.6 percent since July 2014. However, not all local areas, market segments and price points reflect that metropolitan-level reality. This metric is a ratio of supply and demand and indicates how long it would take to completely clear the market assuming no new homes enter the marketplace.

Barring suddenly negative economic data, the Federal Reserve is poised to normalize rates by lifting the Federal Funds rate off of zero starting in September. Mortgage rates are still just below 4.0 percent, compared with a long-term average of over 7.0 percent. Nationally, the economy added 215,000 new private payrolls in July while the unemployment rate held steady at 5.3 percent. The most recent data from the Bureau of Labor Statistics shows the Minneapolis-St. Paul-Bloomington metropolitan area has the third lowest unemployment rate of any major metro.

“We have so many different things going for our region,” said Judy Shields, MAAR President-Elect. “Twin Citizens are smart, and they realize that when rents are high and rising, interest rates are under 4.0 percent and prices are still below their peak, it’s time to consider investing in the stability and predictability of homeownership—in most cases, it’s cheaper than renting.”

From The Skinny Blog.

Where are the lowest prices?

By David Arbit on Wednesday, August 5th, 2015

Though not quite as often as the most expensive areas, we are also occasionally asked which cities are the most affordable (least expensive). Below are tables showing the 25 lowest priced markets in the region. The top two tables rank all areas, regardless of market size. The bottom two tables only show areas with a certain volume of sales. The left table uses only June 2015 sales, while the table to the right uses 2015 YTD data (through June). The measure used is still median sales price.

Even more data to the people!

Lowest-Priced-Cities-7-2015-702x485

Lowest-Priced-Cities-7-2015-with-restrictions-702x501
From The Skinny Blog.

Where are the Highest Prices?

By David Arbit on Wednesday, July 29th, 2015

We are often asked “Which cities have the highest home prices?” Whether it’s a member, the media or the general public inquiring, it’s a fairly common question. Wonder no more! Below are tables showing the top 25 highest priced markets in the region. The top two tables rank all areas, regardless of market size. The bottom two tables only show areas with a certain volume of sales. The left table uses just June 2015 sales, while the table to the right uses 2015 YTD data. Of course, the measure used is median sales price.

Data to the people!

Highest-Priced-Cities-7-20151-702x494
Highest-Priced-Cities-7-2015-with-restrictions1-702x501

From The Skinny Blog.

Conventional is King Again as Government and Investors Exit

By David Arbit on Monday, July 20th, 2015

MortgageFinanceRates_2015-063-702x492The changing popularity of various home financing tools tells a unique story and shows how the government and private sector mortgage market shares have evolved through the housing crisis and subsequent recovery.

Following the ebbs and flows of the housing market itself, the mortgage finance marketplace has also transformed over the last decade. First, some scene setting. Each trendline above represents the percentage of closed sales in the Twin Cities 13-County MSA that utilized a particular form of mortgage financing, by month. No seasonal adjustments have been performed; the data is raw and comes directly from NorthstarMLS.

Between 2005 and mid-2007, conventional loans made up about 80.0 percent of all mortgages. With conventional mortgage liquidity—shall we say—plentiful, the government only represented about 5.0 percent of loans. As the economy and housing market began to unravel in 2007, the mortgage spigot was drying up. As such, the FHA started to take up that slack and became a dominant player in the mortgage marketplace. By the time of the first-time home buyer tax credit in late-2009, FHA loans comprised a whopping 45.0 percent of sales while conventional loans made up about 35.0 percent of sales. The remaining 20.0 percent include all-cash deals and other loan products.

Though its overall effectiveness remains somewhat debatable, that tax credit signaled a turning point—at least in the mortgage market. At that moment in late-2009, conventional loan market share began to recover and FHA market share started to shrink. Fast forward to present day and conventional loans now make up 60.0 percent of the market while FHA loans make up just 20.0 percent. Earlier in 2015, FHA loans made up about 15.0 percent of closed sales, which is consistent with 2004 levels. Most recognize this as a positive, as the private sector has once again assumed the majority of the risk associated with residential mortgage lending.

All-cash sales can also be illuminating, shining light in some of the more interesting nooks and crannies. Though not all cash sales reflect investor activity, it’s one of the better indications of investors in the market and can be used as a proxy.

Between 2004 and 2008, cash deals made up about 5.0 percent of all closed sales. By February 2011, about 28.0 percent of Twin Cities homes were purchased with cash—a record high. Note the dashed orange trendline. This was at the same time as distressed (foreclosure and short sale) market share was at its highest. Traditional sales volume had fallen dramatically and investors were picking up foreclosures for $0.30 – $0.70 cents on the dollar.

Of the consumers that could, even they were understandably nervous to make large purchases such as a home. Nowadays, about 12.0 percent of sales are done in cash, the lowest share in seven years, or since the middle of 2008. That reflects a mixture of fewer foreclosures and short sales, rising prices, a rising stock market attracting more capital and low inventory levels frustrating traditional buyers and investors alike.

The market numbers are well and good, but sometimes following the money can tell a unique story. The modes of financing behind the market can signal changes in investor behavior, consumer confidence, bank lending patterns and how those forces interplay with one another.
From The Skinny Blog.

Pending and Closed Sales Both Reach Highest Level Since June 2005

By Aubray Erhardt on Monday, July 13th, 2015

The Twin Cities metropolitan housing market reached key milestones in June. Both pending purchase demand and closed unit sales officially reached 10-year highs. The last time demand was this strong was June 2005. The number of signed purchase agreements rose 19.2 percent to 6,266. Closed sales increased 22.0 percent to 6,928. Seller activity showed more modest gains compared to last year. New listings rose 4.6 percent to 8,678 during the month, which is a multi-year high. It’s the highest number of new listings for any month since April 2010. Excluding March and April of 2010, new listings were at their highest level for any month since June 2008. Despite that, the number of available properties fell 9.4 percent to 16,597 homes.

2015-06_ClosedSales-310x225

“Buyers have been extraordinarily active this spring and summer,” said Mike Hoffman, Minneapolis Area Association of REALTORS® (MAAR) President. “With both pending and closed sales activity officially reaching 10-year highs, consumers— particularly first-time buyers—understand that the timing is right. Therefore, sellers are also getting strong offers quickly.”

Given all this demand, the June 2015 median sales price climbed 4.7 percent to $229,900. That puts home prices within about 3.5 percent of the June 2006 record high of $238,000. However, the typical price per square foot, now at $128, is about 18.5 percent below its June 2006 record high.

The market landscape continues to favor sellers, even though it is still a historically attractive time to purchase real property. Because of the ongoing imbalance between supply and demand, the number of days a listing spends on the market fell 5.7 percent to 66 days. Sellers are accepting 97.8 percent of their original list price and 99.6 percent of their last list price. The Twin Cities metropolitan area currently has 3.6 months’ supply of inventory, which still signals a seller’s market. That figure dropped 18.2 percent from June 2014. This measure is essentially a ratio of supply and demand and indicates how long it would take to completely clear the market of all inventory assuming no new homes enter the marketplace.

According to the Federal Reserve, interest rates could still rise slowly later this year if the economy continues to perform well as it has been. Mortgage rates continue to hover on either side of 4.0 percent, compared with a long-term average of over 7.0 percent. The most recent data from the Bureau of Labor Statistics shows the Minneapolis-St. Paul-Bloomington metropolitan area has the third lowest unemployment rate of any major metro. That puts our region behind only sister cities Austin, TX and Salt Lake City, UT. Minnesota and the Twin Cities specifically are uniquely well positioned to compete in today’s global economy.

“With positive momentum in housing and the economy, agents across the region are helping buyers and sellers achieve their real estate goals,” said Judy Shields, MAAR President-Elect. “Since most sellers are also buyers, those sitting on the fence may not want to wait to make their move.”
From The Skinny Blog.

Getting Over 100% Of Your List Price

By David Arbit on Monday, July 6th, 2015

Percent_of_all_Sales_Above_X-percent-of-orig-price_NEW-702x500

Real estate professionals understand that there is an imbalance between supply and demand in most markets across the U.S. Buyers have been highly motivated by a variety of factors ranging from low (but rising) interest rates, job growth, rising rents, general optimism and other dynamics. Seller activity, however, has been more restrained—though there’s some evidence that’s starting to change.

In the Twin Cities, that imbalance between supply and demand has driven down absorption rates. With 3.6 months supply of inventory (5-6 is considered “balanced”), our market is still tilting toward sellers. In other words, low inventory combined with strong demand means many sellers are receiving multiple offers on well-priced and well-presented listings.

Buyers are essentially competing with each other in order to purchase the limited number of desirable homes on the market. It’s a regional bidding war: as buyers vie against one another, they may offer more than the list price of the home in order to win the day. That means sellers are sometimes yielding over 100 percent of their list price. It’s a dream-come-true for sellers. Now it just has to appraise!

In 2005, a full 33.8 percent of all closed sales sold for over 100 percent of the current list price. That’s over 1 in 3 sellers receiving more than their asking price. That figure fell to 18.9 percent as the market crash began in 2007, and it touched that low again in 2011. By 2013—a very strong recovery year—the figure had increased to 26.4 percent. After falling again to 22.0 percent of all sales in 2014, the number of homes that sold above list price has increased to 24.8 percent so far in 2015. With the second half of 2015 yet to be recorded, it’s possible we will end the year near 2013 levels, particularly as buyers face the looming risk of rising interest rates combined with climbing rents and an improving labor market.

Ultimately, a healthy and sustainable housing market should be well-balanced between sellers and buyers, supply and demand. A healthy market means relative equilibrium, one that favors neither buyers nor sellers, but allows for both sides of the transaction to successfully reach their goals. A healthy market means sellers are enjoying some appreciation but home prices aren’t dramatically outpacing incomes. After about a decade of lurching between boom and bust, the Twin Cities housing market as well as others across the nation finally seem to be settling into a healthy groove—for the time being.

Is Bigger Better?

By David Arbit on Friday, June 26th, 2015

COMPARING SQUARE FOOTAGE TRENDS IN THE NEW CONSTRUCTION AND PREVIOUSLY OWNED SEGMENTS

New construction prices not only recovered far faster than previously owned prices, but they have also reached an all-time high (see chart). The median sales price for new construction was about $268,000 in 2009 but has since soared to new highs of just over $376,000. Previously owned prices, by contrast, reached $228,000 in 2006 but are now at $205,000. What’s driving this, you ask?

A multitude of factors have encouraged new home prices to stretch to new heights. Builders, contractors and suppliers will tell you that input costs have risen and that is true. Labor, copper, concrete, PVC, drywall and other related commodity prices have all risen lately. Steel prices, however—which make up a small share of overall construction costs—have fallen as China has flooded the global market with cheap steel. China now produces as much steel as the rest of the world combined. Lumber prices increased over the last few months, but have mostly declined since 2013. Lumber prices on the Chicago Mercantile Exchange are on-par with 2010. Let’s not digress too much.

Square-Footage-Trends-by-Segment-310x225

Something else noteworthy is happening, and this graph illustrates it pretty well. Though perhaps unsurprisingly, the total square footage of new construction is increasing at a far faster rate than the previously owned segment. Between May 2005 and May 2015, the median square footage of newly constructed homes rose 65.2 percent. During that same period, the median square footage of previously owned properties only increased 7.1 percent. For new construction, the typical home was built with 1,614 total finished square feet in 2005 but that figure grew to 2,667 total finished square feet by 2015. By contrast, the typical resale home had 1,700 square feet in 2005 but has only risen to 1,821 square feet as of May of this year. Interestingly, previously owned homes tended to be larger than new construction in 2005.

The nature of previously owned properties is that they don’t change that much. Those properties are already built. The 7.1 percent increase can be explained by two different dynamics. First, those who are selling and buying resale homes are tending to list and purchase slightly larger properties. Second, through remodeling projects such as a master bedroom addition or finishing off a basement or attic space, the existing housing stock can increase in finished square footage even though the foundation is already in the ground.

So what does this all mean? Well for one thing, those who have ruled out purchasing a newly built home because prices are at all-time highs might reconsider once they realize what’s causing that. Builders are constructing larger and larger homes, but not every newly built home is enormous and over $1 million. In fact, new construction can be fairly competitive with existing resale properties in certain areas and price points. Additionally, though the median sales price is at an all-time high, the price per square foot is not even back to bubble levels (see chart).

Another factor to keep in mind is that a lot of new construction in 2005 was condo-centric, particularly in and around both downtowns. As the condo bubble burst, development shifted toward single family products on larger suburban lots. Condos obviously tend to be smaller than single family homes, so that was certainly constraining square footages 10 years ago. In other words, a low baseline can impact this sort of analysis as much as if not more so than the current period. The large increase in new construction may be explained by a low 2005 figure as opposed to a high 2015 figure, though both dynamics

As we become ever more cognizant of energy efficiency, carbon footprints, insulation and everything that comes with it, there is some anecdotal evidence that smaller housing products are gaining popularity and it seems to be consumer-driven. There are even entire communities of “micro homes” (see article). So, despite the trend in new construction, perhaps bigger won’t always be better.

Twin Cities Home Price Analysis

By David Arbit on Thursday, June 18th, 2015

Assuming-5-pct-appreciation-310x225
After nearly 10 years, home prices are within 6.3 percent of their record high seen in June 2006. We have been here before, but we are in a different environment these days. The labor market has benefited from the longest stretch of private job growth on record, the stock market is at all-time highs, corporate balance sheets have seldom looked this good, we have a more regulated lending environment, consumers are deleveraged, our population has grown and consumers are more cautious this time around.

As we near (errr return to) “peak” pricing, there are several important items to bear in mind. First, this is not a brand new high in some foreign land, it is a return to where the market was 10 years ago but with better fundamentals (see above). Second—and as the chart suggests—if you assume that prices had followed their long term trend of increasing at 5.0 percent per year (nominal, not adjusted for inflation) as they have, we are still not back to where we would be assuming that rate of increase over the last 20 years. Third, this market is not fueled by irrational, unjustified speculation and exuberance—a leading cause of bubble-itus. Rather, it is fueled by low interest rates, rising rents, job growth, a diverse and robust local economy and slowly rising incomes.

Those who remember paying $0.05 for a cup of coffee or a candy bar like to remind us: prices will rise. It is inevitable. To expect home prices not to follow that trend is unrealistic. Once home prices began recovering, it was only a matter of time before they surpass their previous peak. Given all the improvements we have seen in the market and economy, it is no surprise we are back to where we were. But this time, under much better circumstances.
From The Skinny Blog.