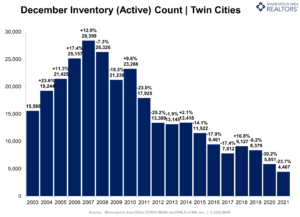
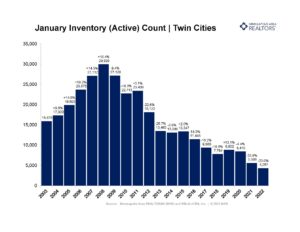
- Metro-wide Inventory is down 24.2 percent since the start of 2021
- Month’s Supply of Inventory (absorption rate) is at a record low, ~ 3 weeks of supply
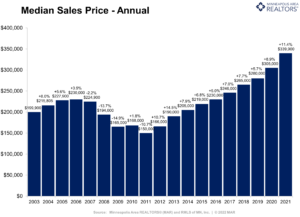
- Median Sales Price rose 10.4 percent to $332,250
(February 15, 2022) – According to new data from Minneapolis Area REALTORS® and the Saint Paul Area Association of REALTORS®, inventory levels in the Twin Cities metropolitan area have reached a decades-long low of 4,221 homes at the end of January. At the current rate of demand, this inventory would last little more than three weeks without the addition of new listings. The market would require six months of supply in order to be considered balanced.
LISTINGS & SALES
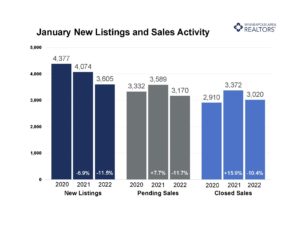
Real estate in the Twin Cities saw a peak of buyer activity throughout 2021, but only now are we able to see the extent of that increased demand. Year over year comparisons of pending sales indicate a noticeable drop of 11.7 percent from last January, but a more historical perspective shows that the 3,170 purchase agreements signed last month are comparable to January of 2019 and 2018. Closed sales show a similar picture, 2022 is not starting off with the same fervor as 2021. The same goes for sellers, resulting in an 11.5 percent drop in supply since last January.
“The year began about as expected, with both sales and listings unable to match their year-ago levels,” said Denise Mazone, President of Minneapolis Area REALTORS®. “But don’t get the wrong idea, the market is expected to remain pretty hot this year as demand continues to outpace supply but also as buyers hope to get ahead of rising rates.”
INVENTORY
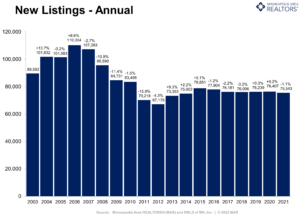
While the supply of new listings has historically been a concern for over a decade, the public could usually count on consistent year-over-year activity from sellers until 2020. A sharp fall in supply two summers ago followed by a rebound in 2021 led to variations in seller activity unseen since 2015. Last month sellers listed 3,605 properties on the market, our lowest level of seller activity since 2005.
“It’s important that market participants understand what less than 1.0 month of supply means,” according to Mark Mason, President of the Saint Paul Area Association of REALTORS®. “This means well-priced and attractive listings will sell quickly and often with multiple offers in play. Buyers should be patient but prepared to write strong, non-contingent offers while sellers should be ready to move quickly.”
HOME PRICES
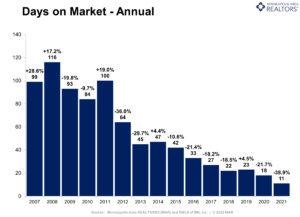
The stark contrast between lackluster seller activity and the remaining rush of demand from buyers leaves the Twin Cities with a housing market where half of its listings last no longer than 21 days, down 4.5 percent from a year prior. This strong seller’s market has driven up the price of listings, now at $332,250 which is the highest January median sales price on record. These market dynamics, if left unchanged, show signs of high market prices and stiff competition for buyers as the weather warms.
LOCATION & PROPERTY TYPE
Market activity varies by area, price point and property type. The condominium market has seen a significant increase in the past year, yet January was the first significant drop in the number of condo sales, down 11.5 percent. New construction has hit a downward trend since last summer and this trend continues with a 6.8 percent decrease in sales. Between Minneapolis and St. Paul, the state capitol city fared better for the first month of the year, seeing a 2.3 percent increase in closed sales while Minneapolis experienced a 16.1 percent drop in sales. The suburban cities that showed the most sales growth in January were Savage (100 percent), Chanhassen (50.0 percent), and Stillwater (45.5 percent) while those that lost the most sales from last year were West Bloomington (- 43.9 percent), Lakeville (- 43.0 percent), and St. Louis Park (- 41.7 percent).
January 2022 by the numbers compared to a year ago
-
- Sellers listed 3,605 properties on the market, an 11.5 percent decrease from last January
- Buyers signed 3,170 purchase agreements, down 11.7 percent (3,020 closed sales, down 10.4 percent)
- Inventory levels fell 24.2 percent to 4,221 units at month-end
- Months Supply of Inventory was down 20.0 percent to 0.8 months (4-6 months is balanced)
- The Median Sales Price rose 10.4 percent to $332,250
- Days on Market fell 2.4 percent to 41 days, on average (median of 21 days, down 4.5 percent from January 2021)
- Changes in Sales activity varied by market segment
- Single family sales fell 11.0 percent; Condo sales declined 11.5 percent & townhouse sales were down 4.5 percent
- Traditional sales decreased 9.3 percent; foreclosure sales tumbled 32.4 percent; short sales fell 69.2 percent
- Previously owned sales were 9.9 percent lower; new construction sales were 6.8 percent lower
January 2022 housing charts
 For Week Ending February 5, 2022