Weekly Market Report

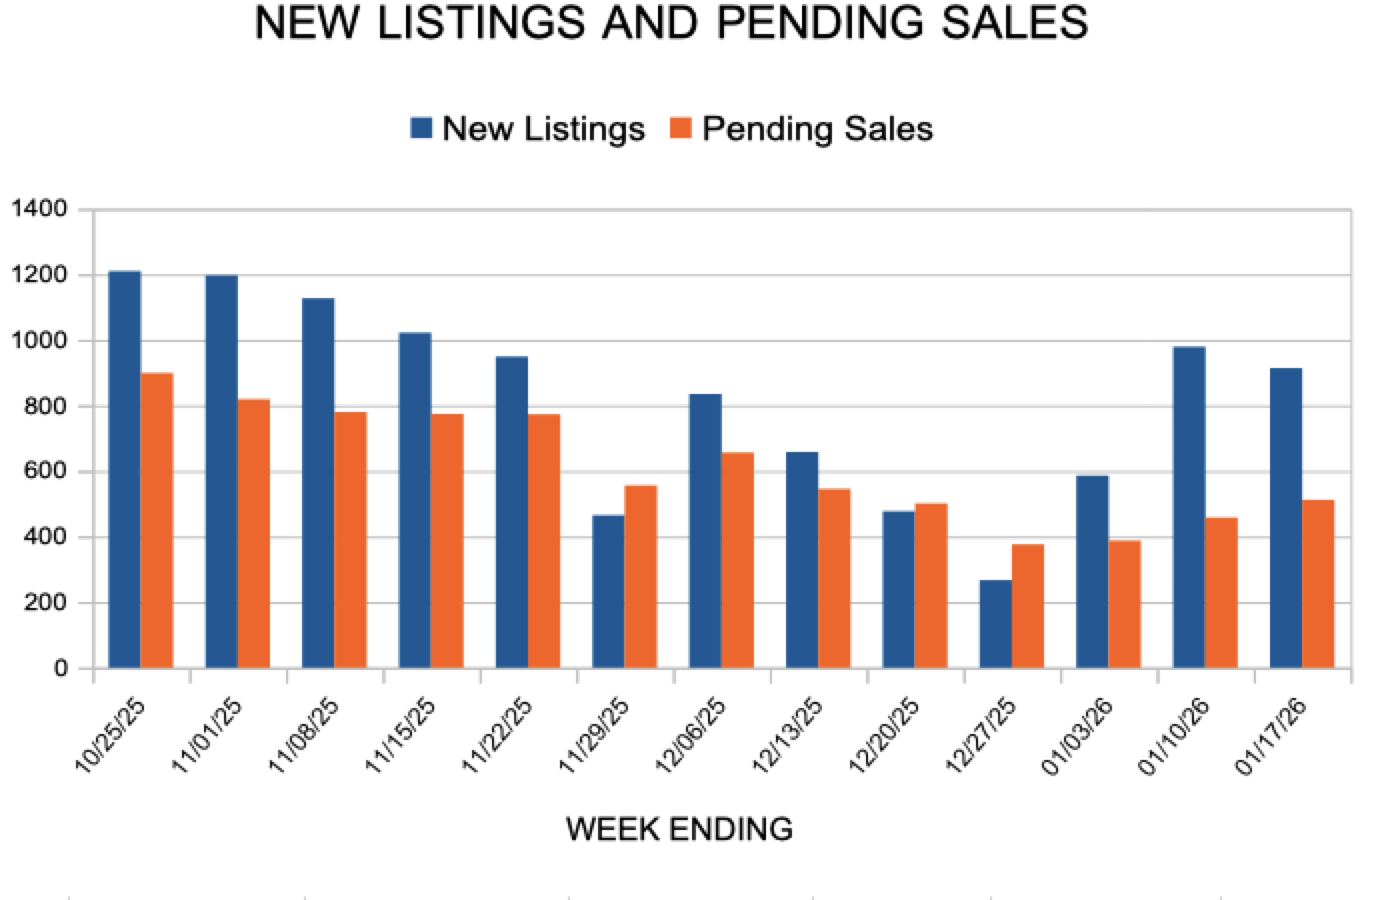
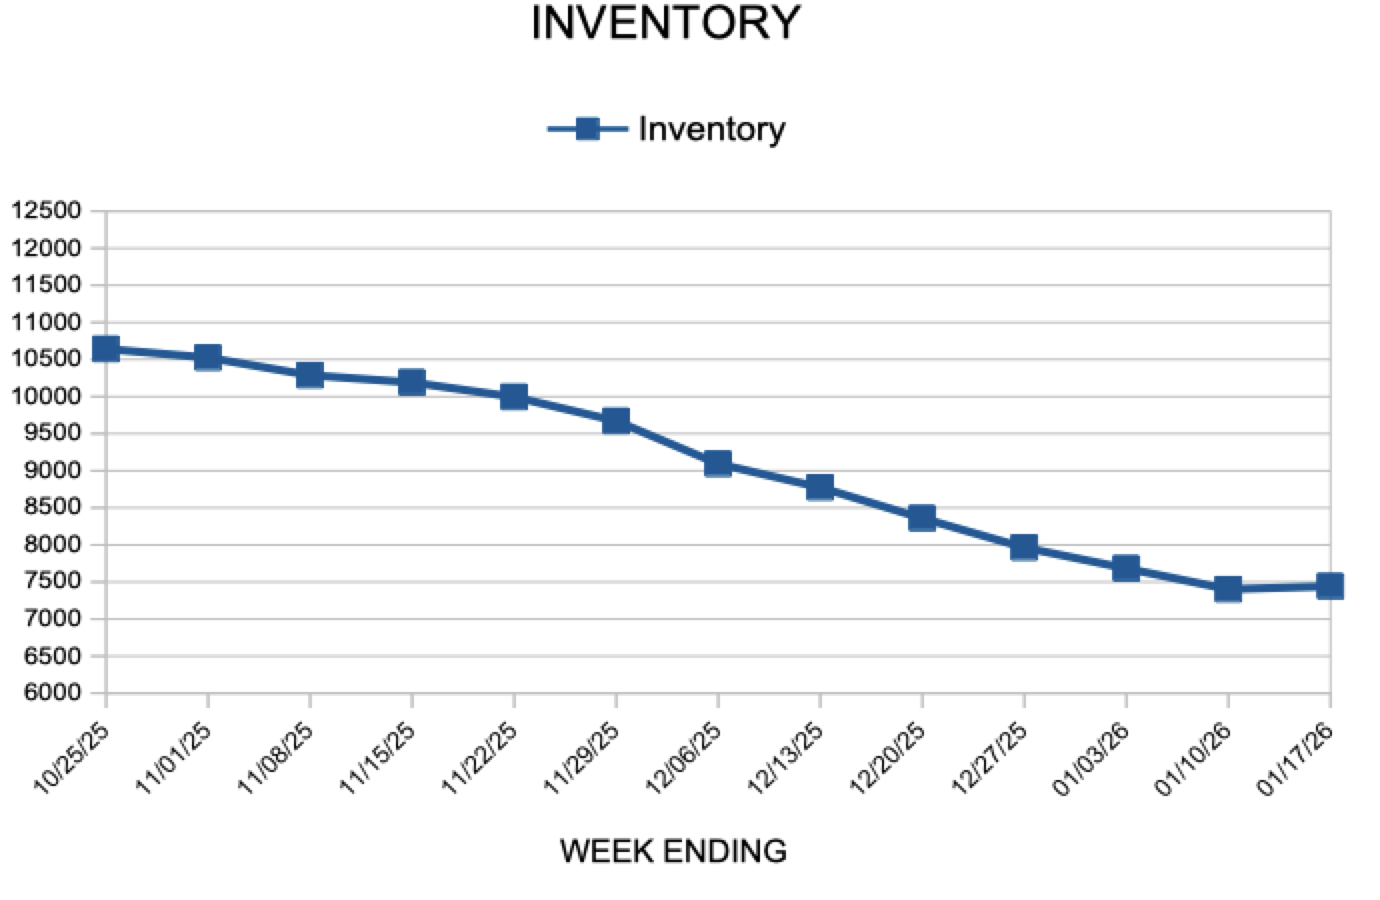
For Week Ending January 10, 2026

The U.S. homeownership rate climbed to 65.3% in the third quarter of 2025, up from 65% in the second quarter, according to the U.S. Census Bureau. The homeownership rate remains below the 25-year average rate of 66.3% and is 3.9 percentage points lower than the peak of 69.2% in 2004. Nearly 90% of housing units were occupied in the third quarter, and just over 10% were vacant.

IN THE TWIN CITIES REGION, FOR THE WEEK ENDING JANUARY 10:

  • New Listings decreased 5.1% to 979
  • Pending Sales decreased 13.6% to 458
  • Inventory decreased 1.6% to 7,401

FOR THE MONTH OF DECEMBER:

  • Median Sales Price increased 2.7% to $380,000
  • Days on Market increased 3.6% to 58
  • Percent of Original List Price Received decreased 0.2% to 96.8%
  • Months Supply of Homes For Sale decreased 5.0% to 1.9

All comparisons are to 2025

Click here for the full Weekly Market Activity Report. From MAAR Market Data News.

REALTORS® Eye Housing Recovery

Housing recovery pushed forward during October. Just like most of this year, more homes sold in less time at higher prices and for closer to asking price than last year. During October, 4,483 homes went under contract, 34.0 percent higher than October 2011. There were 4,262 closed sales, a 15.1 percent increase over last year. The median sales price was up 14.8 percent to $175,000.

The 10K Housing Value Index showed a 7.4 percent increase to $172,804. Seller confidence is improving, as 5,301 homes were placed onto the market, 7.5 percent more than last year at this time. The number of homes for sale fell 29.7 percent to 15,002 active listings—the lowest number since before January 2003.

The median sales price has now risen for eight consecutive months. That’s being driven by three primary factors: less supply, more demand and a healing distressed segment. Overall, new listings were up 7.5 percent, but traditional new listings were up 25.4 percent while both foreclosure and short sale new listings were down 7.5 and 31.6 percent, respectively.

Prices were up across the board. The overall median sales price was up 14.8 percent to $175,000; the traditional median price was up 9.6 percent to $212,500; the foreclosure price was up 15.2 percent to $123,500; and the short sale price was up 4.2 percent to $131,871, only the second year-over-year gain since June 2008.

Traditional sales made up 64.4 percent of sales, foreclosures 25.1 percent and short sales 10.5 percent.

The number of homes for sale has dropped for 21 consecutive months and is just above 15,000, the lowest level for any month since January 2003. Months’ supply of inventory fell 41.4 percent to 3.7 months. This indicates that the market is on the brink of favoring sellers. Figures below 4.0 months of supply are typically hallmarks of sellers’ markets.

Sellers can take some comfort in these ongoing improvements. Homes sold in an average of 104 days, 24.8 percent less time than last October. Sellers, on average, received 94.4 percent of their list price, 3.5 percent more than last year. Cash buyers made up 21.2 percent of all closed sales.

Positive Housing Outlook is the Rule of the Day

Local housing market recovery continues to roll forward in the Twin Cities 13-county metropolitan area. In September, more homes sold in less time at higher prices and for closer to asking price than last year. During the month, 4,032 homes went under contract, 11.0 percent higher than September 2011. The median sales price was up 12.3 percent to $174,000; the 10K Housing Value Index showed a more modest 6.8 percent increase to $172,208. The only missing component was seller confidence. Sellers brought 5,341 properties to the market, 4.1 percent fewer than last year. The number of homes for sale on the market fell 29.4 percent to 15,996—near a 9-year low – making seller conviction and optimism increasingly critical.

“One of the most encouraging changes in the market has been more traditional homes and fewer foreclosures,” said Cari Linn, President of the Minneapolis Area Association of REALTORS®. “There’s finally some room to breathe for traditional sellers.”

At 30.6 percent for September 2012, the percentage of all new listings that were lender-mediated (either foreclosure or short sale) was at its lowest level since June 2008. The percentage of all lender-mediated closed sales was 35.3 percent.

These distressed sales tended to sell at a 26.6 percent discount compared to the overall market. Overall median sales price was up 12.3 percent, but prices varied by sale type. Traditional median home prices were up 6.2 percent to $207,000; foreclosure prices were up 13.7 percent to $125,000; and short sale prices were up 0.8 percent to $131,000, their first gain since June 2008.

The number of homes for sale has dropped for 20 consecutive months and is below 16,000 for the first time since December 2003. Months’ supply of inventory fell 40.9 percent to 4.0 months. This indicates that the market is on the brink of favoring sellers. Figures below 4.0 months supply are moving toward a sellers’ market.

The landscape for sellers continues to brighten. On average, homes sold in 101 days, 28.7 percent faster than last year at this time. Sellers received, on average, 94.8 percent of their list price, 4.1 percent more than last year. Cash buyers made up 19.3 percent of all closed sales.

“Interest rates in the Twin Cities are around 3.4 percent and buyers have a justified sense of urgency,” said Andy Fazendin, MAAR President-Elect. “Housing has gone from a laggard the past few years to leading the charge in 2012.”

Recovery Evidence Mounts, Distressed Sales Rate Hits Multi-Year Low

Minneapolis, Minnesota (July 12, 2012) – The empirical evidence of a market in recovery is beginning to accumulate. Sales counts and prices are up; inventory and months of supply are down. In June 2012, buyers signed 4,917 purchase agreements, 16.0 percent higher than June 2011.

Sellers introduced 6,359 properties to the market, 8.1 percent fewer than last June. The number of homes for sale has dropped for 17 consecutive months, down 31.2 percent from last year to 17,103 active listings – the lowest inventory reading for any month since January 2004. Months’ supply of inventory dropped 44.6 percent to 4.4 months – the lowest reading for any month since December 2005.

The median sales price rose 10.7 percent to $179,500. That’s the second-largest gain since January 2004 and the fourth consecutive month of year-over-year gains. Excluding only June 2010, home prices are at their highest level since October 2008.

Homes sold in 113 days, on average, down 22.0 percent from last year. Sellers received an average of 95.1 percent of their list price, up 4.0 percent from last year. Cash buyers made up 19.3 percent of all closed sales.

“It’s difficult to find a negative trend in the local housing market right now,” said Cari Linn, President of the Minneapolis Area Association of REALTORS® (MAAR). “After many years of decline, it’s a welcome change of pace.”

One catalyst enabling these trends is the declining role of lender-mediated market activity, also known as distressed sales (foreclosures and short sales)

Distressed sales accounted for 30.6 percent of all new listings and 34.6 percent of all closed sales, the lowest shares since June 2008 and August 2008, respectively.

Looking at price movement by market segment, traditional median home prices were up 3.4 percent to $215,000, foreclosure prices were up 10.5 percent to $124,700 and short sales were down 2.7 percent to $126,500. Traditional homes sold for nearly 75.0 percent more than foreclosures and accounted for 65.4 percent of sales volumes, highlighting the importance of market share relative to overall market median sales price.

“This is what we hoped to see with distressed sales,” said Andy Fazendin, MAAR President-Elect. “Now we just need to get traditional inventory in line with buyer demand. With rents on the rise and mortgage rates maintaining at historical lows, potential sellers should take note.”

All information is according to the Minneapolis Area Association of REALTORS® (MAAR) based on data from the Regional Multiple Listing Service of Minnesota, Inc. MAAR is the leading regional advocate and provider of information services and research on the real estate industry for brokers, real estate professionals and the public. MAAR serves the Twin Cities 13-county metro area and western Wisconsin.

Read it on The Skinny

Weekly Market Report

The last time you were at the doctor, your vital signs were checked – heart rate, pulse, temperature and blood pressure. Progress was documented and valuable insights were gained, whether it was a routine visit or one of many checks during an extended hospital stay. The housing market has been in and out of intensive care for the past several years. Monitoring vitals matters, and that’s what you’ll find on the following pages. The pulse of today’s market indicates that we may be getting ready to leave the ICU. So if you could just please pull up your sleeve, let’s check your blood pressure.

In the Twin Cities region, for the week ending March 24:

  • New Listings increased 2.2% to 1,414
  • Pending Sales increased 30.2% to 1,052
  • Inventory decreased 27.3% to 17,193

For the month of February:

  • Median Sales Price decreased 1.4% to $138,000
  • Days on Market decreased 9.0% to 145
  • Percent of Original List Price Received increased 2.5% to 90.6%
  • Months Supply of Inventory decreased 34.8% to 4.7

Click here for the full Weekly Market Activity Report.

From The Skinny.

Weekly Market Report

For Week Ending January 17, 2026

The average 30-year fixed mortgage rate fell to 6.06% the week ending January 15, 2026, the lowest level since September 2022, according to Freddie Mac. The Mortgage Bankers Association noted that lower rates have coincided with a rise in purchase and refinance applications, as borrowers respond to recent improvements in affordability.

IN THE TWIN CITIES REGION, FOR THE WEEK ENDING JANUARY 17:

  • New Listings decreased 3.6% to 914
  • Pending Sales decreased 15.1% to 512
  • Inventory decreased 1.3% to 7,441

FOR THE MONTH OF DECEMBER:

  • Median Sales Price increased 2.7% to $380,000
  • Days on Market increased 3.6% to 58
  • Percent of Original List Price Received decreased 0.2% to 96.8%
  • Months Supply of Homes For Sale decreased 5.0% to 1.9

All comparisons are to 2025

Click here for the full Weekly Market Activity Report. From MAAR Market Data News.

Weekly Market Report

For Week Ending January 3, 2026

The National Association of REALTORS® (NAR) forecasts a 14% increase in existing-home sales in 2026, alongside a 5% rise in new-home sales. These gains are being fueled by steady job growth, softening mortgage rates, and improving overall market conditions. Home prices are projected to grow 4% this year, reflecting sustained demand and ongoing inventory constraints.

IN THE TWIN CITIES REGION, FOR THE WEEK ENDING JANUARY 3:

  • New Listings decreased 18.9% to 586
  • Pending Sales decreased 11.8% to 387
  • Inventory decreased 2.6% to 7,683

FOR THE MONTH OF NOVEMBER:

  • Median Sales Price increased 2.9% to $387,000
  • Days on Market remained flat at 50
  • Percent of Original List Price Received decreased 0.2% to 97.4%
  • Months Supply of Homes For Sale remained flat at 2.5

All comparisons are to 2025

Click here for the full Weekly Market Activity Report. From MAAR Market Data News.

Weekly Market Report

For Week Ending December 27, 2025

Nationally, 46.1% of mortgaged residential properties were classified as equity-rich in the third quarter of 2025, according to ATTOM’s latest 2025 U.S. Home Equity & Underwater Report. This marks a slight decline from 47.4% the previous quarter and from 48.3% the same time last year. The three states with the highest share of equity-rich properties were Vermont (86.8%), New Hampshire (61.4%), and Rhode Island (59.8%).

IN THE TWIN CITIES REGION, FOR THE WEEK ENDING DECEMBER 27:

  • New Listings decreased 22.4% to 267
  • Pending Sales decreased 11.9% to 376
  • Inventory decreased 2.9% to 7,964

FOR THE MONTH OF NOVEMBER:

  • Median Sales Price increased 2.9% to $387,000
  • Days on Market remained flat at 50
  • Percent of Original List Price Received decreased 0.2% to 97.4%
  • Months Supply of Homes For Sale remained flat at 2.

All comparisons are to 2024

Click here for the full Weekly Market Activity Report. From MAAR Market Data News.