In between days. The spring and summer selling seasons are well behind us, and the holiday slowdown is well ahead of us (except in some department stores). As the days grow shorter, housing numbers may not be as thrilling as they were in recent months, but the trends remain the same. Compared to last year, sales are regularly up and inventory figures are down, including months of supply. Sales and prices will surely drop, but there is reason for optimism through the end of the year, providing a cure to several years of little to hold on to.
In the Twin Cities region, for the week ending October 6:
- New Listings increased 2.8% to 1,301
- Pending Sales increased 33.5% to 1,049
- Inventory decreased 28.6% to 16,113
For the month of September:
- Median Sales Price increased 12.6% to $174,500
- Days on Market decreased 28.5% to 101
- Percent of Original List Price Received increased 4.0% to 94.8%
- Months Supply of Inventory decreased 40.1% to 4.0
Weekly Market Report
Some say that housing and the economy are woven together into a single garment of destiny. Let’s review recent national economic data: a good September non-farm payroll report marking 31 consecutive months of private job growth, the unemployment rate falling to 7.8 percent (a 44-month low), a widely positive S&P/Case-Shiller home price report and mortgage rates averaging close to 3.4 percent. Combine the above trends with less housing supply and strong home sales numbers, and you can start to see just what’s driving this recovery. Here’s what transpired locally.
In the Twin Cities region, for the week ending September 29:
- New Listings increased 6.2% to 1,314
- Pending Sales increased 15.5% to 1,000
- Inventory decreased 29.6% to 16,261
For the month of September:
- Median Sales Price increased 12.3% to $174,000
- Days on Market decreased 28.7% to 101
- Percent of Original List Price Received increased 4.1% to 94.8%
- Months Supply of Inventory decreased 40.9% to 4.0
Weekly Market Report
With October just around the corner, 2012 has certainly flown by. The things to be watching for this fall are the same things you’ve likely been watching all year. Changes in sales levels, active listings, market times, seller concessions and, of course, home prices have taken center stage. To showcase just one, home prices may moderate on a month-to-month basis but should continue to demonstrate resiliency in a year-over-year sense. While the economy has been sending some mixed signals lately, one aspect of this recovery remains convincing: housing will be a net contributor.
In the Twin Cities region, for the week ending September 22:
- New Listings decreased 1.1% to 1,295
- Pending Sales increased 22.8% to 1,078
- Inventory decreased 29.4% to 16,428
For the month of August:
- Median Sales Price increased 14.8% to $178,000
- Days on Market decreased 23.9% to 107
- Percent of Original List Price Received increased 4.2% to 95.1%
- Months Supply of Inventory decreased 41.1% to 4.2
September Monthly Skinny Video
Where has the Twin Cities real estate market been and where is it heading? This monthly summary provides an overview of current trends and projections for future activity. Narrated by Emily Green (2012 Secretary, Minneapolis Area Association of REALTORS®), video produced by Chelsie Lopez.
Weekly Market Report
On September 13, the Federal Reserve announced its third round of quantitative easing (QE3). This time, it took the form of $40 billion in mortgage-backed securities (MBS) purchases each month. The goal is to bolster the stock market by diminishing returns on MBSs. This will make equities more attractive, which will provide capital to corporations, who should in turn hire and therefore spur consumer spending. If successful, that job creation and spending will resonate into housing consumption and reinvestment. New jobs fuel housing demand which alleviates underwater homeowners and supports home prices. Here’s how we rounded out the week.
In the Twin Cities region, for the week ending September 15:
- New Listings increased 4.0% to 1,360
- Pending Sales increased 18.4% to 978
- Inventory decreased 29.5% to 16,479
For the month of August:
- Median Sales Price increased 14.8% to $178,000
- Days on Market decreased 23.9% to 107
- Percent of Original List Price Received increased 4.2% to 95.1%
- Months Supply of Inventory decreased 41.5% to 4.2
Mortgage Rates at Record Lows
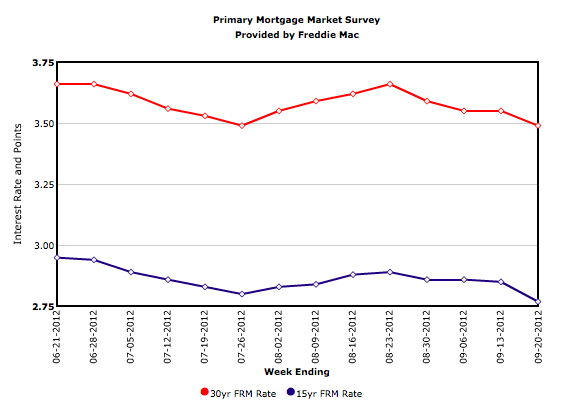
 Freddie Mac’s Primary Mortgage Market Survey (PMMS®) results released Sept. 20 showed fixed mortgage rates at or near their all-time record lows. The average 30-year fixed rate mortgage matched its all-time record low at 3.49 percent, and the average 15-year fixed fell to a new all-time record low at 2.77 percent.
Weekly Market Report
You fill the pot with the water and you turn the stovetop on and you wait. You watch it and you want something to happen and it seems to take an exceptionally long time. All you want to do is add the noodles or the white rice or the frozen vegetables. And you wait. Because it’s important to wait until the water is roiling along in what is seemingly chaotic motion but is really the perfect environment for what is meant to be within it. This is our current housing market. It’s been an undeniably good spring and summer, and now we wait to see if the fall showcase is just as good if we mix in the right amount of inventory, sales and days on market.
In the Twin Cities region, for the week ending September 8:
- New Listings increased 2.2% to 1,273
- Pending Sales increased 24.2% to 940
- Inventory decreased 29.6% to 16,458
For the month of August:
- Median Sales Price increased 15.2% to $178,600
- Days on Market decreased 24.0% to 107
- Percent of Original List Price Received increased 4.2% to 95.1%
- Months Supply of Inventory decreased 42.0% to 4.1
Sales and Prices on the Ups as Inventory and Foreclosures Fall
For the past six months, nearly every housing market measure has indicated improvement. The Twin Cities housing recovery is gaining momentum. What’s more, the recovery has shown signs of both depth (consistency and continuity) and breadth (improvement across numerous indicators). Below are a few statistics organized by topic that equate to market recovery. Numbers given are for August 2012 and percentage increases and decreases are compared to August 2011 unless otherwise noted.
- SALES
- There were 4,877 pending sales, up 19.5 percent and marking the 16th consecutive month of increase.
- There were 4,883 closed sales, up 12.3 percent, marking the 14th consecutive month of increase.
- In June 2012, closed sales fell just 6 units short of a nearly 6-year high (70 months).
- LISTINGS
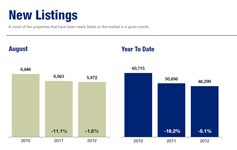
- There were 5,972 new listings, down 1.8 percent but a slight gain from last month.
- There were 16,348 homes for sale, down 30.5 percent and marking the 19th consecutive month of decreases.
- Inventory levels are at their lowest since December 2003, which is nearly a 9-year low (104 months).
- Inventory levels have come down a total of 54.5 percent from their July 2007 peak.
- PRICES
- The median sales price was $179,000, up 15.5 percent and marking the 6th consecutive month of increase.
- The average sales price was $222,922, up 10.4 percent and marking the 7th consecutive month of increase.
- Categorical median sales prices shook out like this: traditional sales were $220,000, up 8.4 percent; foreclosures were $122,750, up 16.9 percent; short sales were $125,100, down 6.6 percent.
- Price per square foot was $104, up 9.3 percent and marking the 6th consecutive month of increase.
- The 10K Housing Value Index, which adjusts for both seasonality and housing segment bias, was up 8.1 percent to $170,656, marking the 5th consecutive month of gains.
- FORECLOSURES
- Foreclosures and short sales (“distressed properties”) comprised 32.4 percent of all new listings.
- Distressed properties comprised 35.1 percent of all active listings.
- Distressed properties comprised 36.0 percent of all closed sales.
“With inventory levels nearing 10-year lows, buyers are scrambling to find the perfect house,” said Cari Linn, President of the Minneapolis Area Association of REALTORS®. “The next step of recovery will be getting hesitant and distressed sellers back into the market.”
Weekly Market Report
Signals. They’re everywhere. From the flow of traffic on Main Street to the movement of electrons inside a microchip, we take our cues from trusted indicators. Recently, housing data has been signaling increased momentum toward recovery. It doesn’t really matter what signals you’re watching either. From new starts, existing sales and prices to market times, seller concessions and the supply-demand balance, all signals point to healing. It won’t necessarily be quick nor felt evenly across all cities or states. But the trend is your friend. And our friend is signaling a thumb’s up.
In the Twin Cities region, for the week ending September 1:
- New Listings decreased 10.1% to 1,171
- Pending Sales increased 13.3% to 1,025
- Inventory decreased 30.0% to 16,676
For the month of August:
- Median Sales Price increased 15.5% to $179,000
- Days on Market decreased 24.1% to 107
- Percent of Original List Price Received increased 4.2% to 95.1%
- Months Supply of Inventory decreased 42.7% to 4.1
Weekly Market Report
We are converging upon an interesting wait-and-see season in residential real estate. All year long, we have witnessed some rather positive year-over-year decreases in inventory numbers and increases in sales, percent of original list price received at sale and median sales price. After many years of struggling to tread water – and, indeed, often failing to do so – there is hope. With quieter autumnal and winter months looming, we will be giving extra scrutiny to the trend lines in the weeks to come.
In the Twin Cities region, for the week ending August 25:
- New Listings increased 1.3% to 1,282
- Pending Sales increased 19.4% to 1,027
- Inventory decreased 29.9% to 16,785
For the month of July:
- Median Sales Price increased 13.3% to $178,500
- Days on Market decreased 27.8% to 105
- Percent of Original List Price Received increased 3.6% to 95.0%
- Months Supply of Inventory decreased 42.1% to 4.4


