- Median sales price of Twin Cities homes rose 2.7 percent to just under $342,000
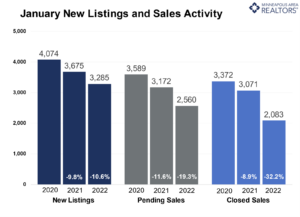
- Buyer activity down 19.3 percent with 2,560 pending sales
- Sellers listed 10.6 percent fewer homes compared to last January
(February 15, 2022) – According to new data from Minneapolis Area REALTORS® and the Saint Paul Area Association of REALTORS®, the median sales price across the Twin Cities grew 2.7 percent to $341,995. The metro is returning to historic trends for median home price growth.
Inventory & Home Prices
The Twin Cities’ median home price grew 2.7 percent despite 19.3 percent fewer signed contracts. After about three straight years of roughly 10.0 percent year-over-year price growth, this modest increase is more aligned with the historical average of 3.2 percent across the region. While price growth is slowing, it remained positive throughout 2022 and this year is expected to continue that trend of moderating growth, barring any unforeseen circumstances.
“Anyone concerned about runaway home prices should be comforted by the more typical price growth we’re seeing, which gives buyers a chance to catch their breath and incomes a chance to catch up,” said Brianne Lawrence, President of the Saint Paul Area Association of REALTORS®. “While the Twin Cities remains a seller’s market, homes are taking longer to sell and sellers are accepting less than their list price.”
Softening buyer activity led to 14.5 percent more homes on the market at month-end, closing out January with 5,588 units in inventory. Yet we remain undersupplied—especially if interest rates moderate in response to inflation subsiding and demand once again soars. The metro only has 1.3 month’s supply of inventory. Typically 4-6 months of supply are needed to reach a balanced market.
Sales & Listings
As the market reacts to a series of aggressive rate hikes by the Federal Reserve in an effort to slow borrowing and cool an overheated economy, home buyer activity has also cooled. Facing higher mortgage rates and monthly payments than they would have in 2022, buyers signed 2,560 purchase agreements, 19.3 percent fewer than last year. Meanwhile 2,083 homes closed, down 32.2 percent from last year and the lowest figure since 2010. But that reflects contracts signed 30 to 60 days earlier.
“Sellers need to be priced right and may not see a dozen plus offers immediately, but most sellers are getting deals done with terms they’re comfortable with, and still more quickly than in the past,” according to Jerry Moscowitz, President of Minneapolis Area REALTORS®. “The truth is, what feels like a slow-down from light speed is actually close to how the market used to and probably should feel. You know, there’s actually a chance that listing you’ve been eyeing will be there later tonight or even tomorrow!”
There were 3,285 homes listed in January, 10.6 percent fewer listings than January 2022. Last month, half of all sellers sold homes for at or below 97.3 percent of their list price compared to 100.0 percent last year. Additionally, they accepted those offers after an average of 60 days on market compared to 41. Today’s sellers should be patient, flexible and ensure their expectations are in-line with market realities.
Location & Property Type
Market activity varies by area, price point and property type. New home sales fell 30.8 percent while existing home sales were down 31.3 percent. Single family sales fell 33.3 percent, condo sales declined 5.7 percent and townhome sales were down 32.3 percent. Sales in Minneapolis decreased 25.8 percent while Saint Paul sales fell 40.2 percent. Cities like St. Michael, Andover, and Minnetonka saw the largest sales gains while Savage, Eagan, and Brooklyn Park all had notably lower demand than last year.
January 2022 Housing Takeaways (compared to a year ago)
- Sellers listed 3,285 properties on the market, a 10.6 percent decrease from last January
- Buyers signed 2,560 purchase agreements, down 19.3 percent (2,083 closed sales, down 32.2 percent)
- Inventory levels grew 14.5 percent to 5,588 units
- Month’s Supply of Inventory rose 44.4 percent to 1.3 months (4-6 months is balanced)
- The Median Sales Price rose 2.7 percent to $341,995
- Days on Market rose 46.3 percent to 60 days, on average (median of 43 days, up 95.5 percent)
- Changes in Sales activity varied by market segment
- Single family sales decreased 33.4 percent; Condo sales were down 5.7 percent & townhouse sales fell 32.7 percent
- Traditional sales declined 31.7 percent; foreclosure sales fell 22.6 percent; short sales fell 25.0 percent
- Previously owned sales decreased 31.3 percent; new construction sales declined 30.8 percent