
New listings up, price growth accelerates, but some activity from Q2 was postponed into July
(August 20, 2020) – According to new data from the Minneapolis Area REALTORS® and the Saint Paul Area Association of REALTORS®, buyer and seller activity in the 16-county Twin Cities metro both increased from 2019.
After double-digit declines in April and May, the number of signed purchase agreements rose 7.5 percent in June and another 10.3 percent in July, both compared to last July. At 6,866, July 2020 saw the highest pending sales figure since at least 2003, and likely longer. However, some of the pent-up demand from April and May was shifted into June and July, meaning sellers accepted about as many offers this July as they typically have in May of each of the prior four years. Nevertheless, the gain has turned even year-to-date pending sales positive—now up 1.3 percent compared to 2019.
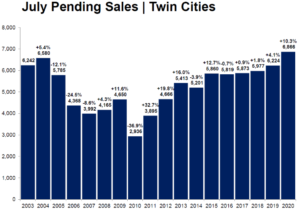
“With interest rates at record lows, in some cases below 3.0 percent, we are experiencing strong demand from buyers to lock in their purchases,” said Patrick Ruble, president of the Saint Paul Area Association of REALTORS®. “If not for the pandemic, some of these accepted offers in July that set new records might have taken place in May or June.”
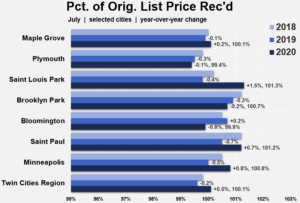
Although new listings increased 0.8 percent from last July, sellers struggled to keep up with all the demand. Those that did sell received, on average, 100.1 percent of their original asking price—the 2nd highest figure on record since 2003 after June 2018. Price growth also accelerated; the median price jumped 10.4 percent to $312,500. Record-low interest rates can partly offset declines in affordability spurred by rising prices.
“July was an undeniably strong month, particularly in light of some of the headwinds,” according to Linda Rogers, President of Minneapolis Area REALTORS®. “Most areas saw sales growth and other improvements, including both large core cities, where buyers continued to outbid each other.”
Minneapolis sellers received offers that were on average 100.8 percent of their list price. In other words, sellers got more than their list price. In St. Louis Park, St. Paul and Brooklyn Park the figures were 101.3, 101.2 and 100.7 percent respectively. Both buyer and seller activity were up double-digits in both Minneapolis and St. Paul.
Some buyers are opting for newer, farther-out suburban subdivisions that are car-dependent and still growing but come with the latest technology and more space for tele-commuting. An uptick in condo listings can anecdotally be attributed more to health concerns and a temporary closure of businesses and limited activities than any recent unrest. More time is needed to evaluate this.
July 2020 by the numbers compared to a year ago
- Sellers listed 7,961 properties on the market, a 0.8 percent increase from last July
- Buyers signed 6,866 purchase agreements, up 10.3 percent (6,940 closed sales, up 3.4 percent)
- Inventory levels fell 28.0 percent to 9,348 units
- Months Supply of Inventory was down 29.6 percent to 1.9 months (5-6 months is balanced)
- The Median Sales Price rose 10.4 percent to $312,500
- Cumulative Days on Market increased 7.9 percent to 41 days, on average (median of 17, down 5.6 percent)
- Changes in Sales activity varied by market segment
- Single family sales were up 7.3 percent; condo sales fell 10.8 percent; townhome sales decreased 2.6 percent
- Traditional sales rose 4.6 percent; foreclosure sales dropped 42.1 percent; short sales fell 6.7 percent
- Previously owned sales were up 2.5 percent; new construction sales climbed 27.7 percent