- Median sales price was up just 5.6 percent to $369,750, the smallest gain since June 2020
- Buyer activity pulled back as pending sales fell 23.8 percent
- Homes took 26 days to sell, 18.2 percent longer than the 22 days last August
(September 16, 2022) – According to new data from Minneapolis Area REALTORS® and the Saint Paul Area Association of REALTORS®, both sales and listing activity were down in August while home price growth has slowed to its lowest level in two years but remains positive. Sellers also accepted lower offers as market times rose.
Inventory & Home Prices
The median home price in the Twin Cities reached $369,750 but the year-over-year growth rate is slowing. While prices are not falling, they’re not rising as quickly as they were. The 5.6 percent price growth in August is below the roughly 8.0 to 16.0 percent gains seen over the last two years. The deceleration in price growth likely reflects the pullback in demand caused by higher interest rates and economic uncertainty. Closed sales were down 20.3 percent in August compared to last year. Buyers also still face low inventory and limited options, although there’s evidence that’s changing.
“We’re seeing a less competitive landscape as the market has slowed given current interest rates,” said Denise Mazone, President of Minneapolis Area REALTORS®. “But the silver lining is that a less frenzied market could spell more inventory and opportunity for persistent buyers.”
August ended with 8,552 homes for sale, nearly flat compared to last year. Although the region is still a seller’s market, the momentum has been shifting back towards a more balanced marketplace. Month’s supply of inventory rose 13.3 percent to 1.7 months.
Sales & Listings
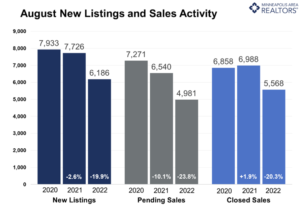
Buyer activity has softened compared to recent years. This is partly caused by higher mortgage rates, but it also reflects demand being pulled forward (i.e. sales that would’ve occurred in 2022/23 instead took place in 2020/21). August showed 4,981 signed purchase agreements, 23.8 percent short of 2021 levels and the lowest August figure since 2014. But seller activity reached its lowest level since August 2012. The easing of demand has impacted how quickly homes sell. Homes remained on market for an average of 26 days, 18.2 percent longer than last August.
“Sellers may notice that their homes are taking an extra few days to go under contract,” according to Mark Mason, President of the Saint Paul Area Association of REALTORS®. “But nobody talks about the fact that even this slower pace is still fast historically. A cooling of red-hot demand and a less intense landscape means a more sustainable and accessible marketplace.”
Sellers listed 6,186 properties on the market, 19.9 percent fewer than last August. Many Baby Boomers are choosing to age in place and aren’t listing their homes. Some homeowners are reluctant to trade into a higher mortgage rate on a higher priced home given economic uncertainty. And, some sellers are choosing to wait given their lack of options once their home sells. The industry has also underbuilt housing for about 15 years, and it will take time to rise out of that deficit.
Location & Property Type
Market activity varies by area, price point and property type. New home sales fell 11.0 percent while existing home sales were down 20.3 percent. Single family sales fell 19.7 percent, condo sales declined 26.7 percent and townhome sales were down 17.4 percent. Sales in Minneapolis decreased 23.3 percent while Saint Paul sales fell 18.9 percent. Cities like Monticello, Golden Valley, and Orono saw the largest sales gains while Stillwater, Chanhassen, and Fridley had lower demand than last year.
August 2022 Housing Takeaways (compared to a year ago)
- Sellers listed 6,186 properties on the market, a 19.9 percent decrease from last August
- Buyers signed 4,981 purchase agreements, down 23.8 percent (5,568 closed sales, down 20.3 percent)
- Inventory levels dropped 1.3 percent to 8,552 units
- Month’s Supply of Inventory rose 13.3 percent to 1.7 months (4-6 months is balanced)
- The Median Sales Pricerose 5.6 percent to $369,750
- Days on Market rose 18.2 percent to 26 days, on average (median of 15 days, up 50.0 percent)
- Changes in Sales activity varied by market segment
- Single family sales decreased 19.7 percent; Condo sales were down 26.7 percent & townhouse sales fell 17.4 percent
- Traditional sales declined 20.0 percent; foreclosure sales fell 20.8 percent; short sales were up 40.0 percent (from 5 to 7)
- Previously owned sales decreased 20.3 percent; new construction sales declined 11.0 percent