
Have you ever wondered to yourself what the home price trendline would look like compared to a hypothetical trendline that starts at the same price in 1990 but increased at a steady and predictable 4% annual growth? Well you’re in luck, because that’s exactly the sort of in-depth market insights that we serve up on a regular basis.
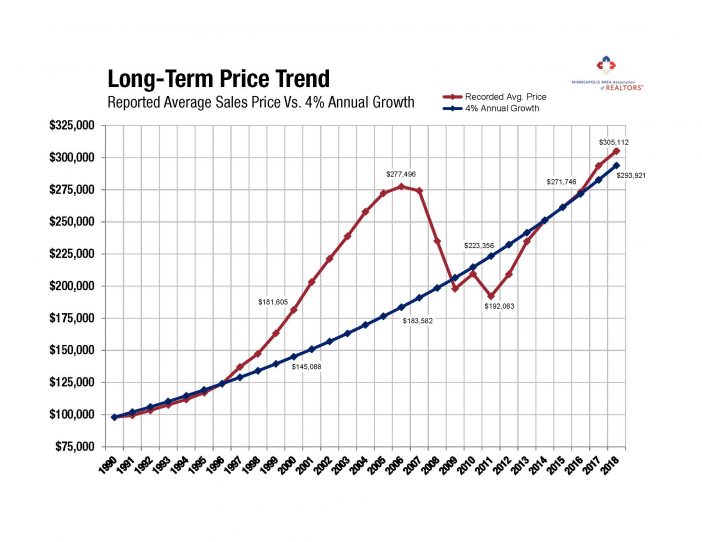
As you can see, recorded average sales prices were well above their trend from 1997 through 2008. The gravity or weight behind the long-term average has an inescapable pull. Some call this return to the average a “reversion to the mean.” There will always be short-term market fluctuations, but the overall long-term direction and growth of the market is upward at around 4-5% per year (before inflation). When we use the 4% figure, prices are only slightly above trend. If we were to use the 5% figure, prices would appear drastically undervalued relative to their long-term average.
The truth, as always, is somewhere in the middle.
*(Note that 2018 data is year-to-date up through April)
From The Skinny Blog.