Author Archives: Mighty Agent
Weekly Market Report
A family earning the nation’s median income of $106,800 needed to spend 32% of its income to afford the mortgage payment on a median-priced home in the first quarter of 2026, according to the National Association of Home Builders (NAHB)/Wells Fargo Cost of Housing Index (CHI). That represents a modest improvement from the fourth quarter of 2025, when a family needed to spend 34% of its income on housing.
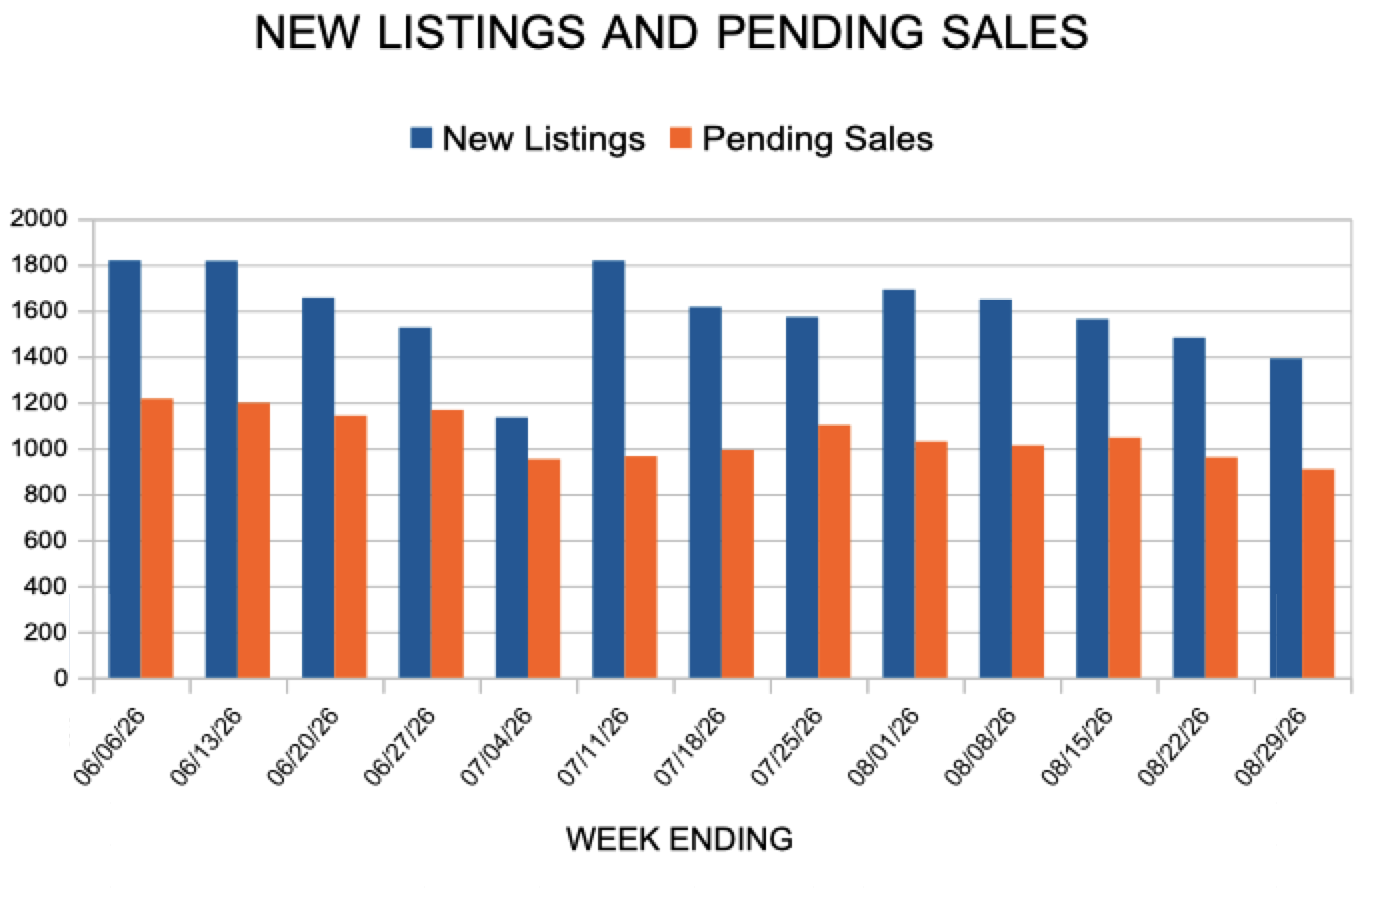
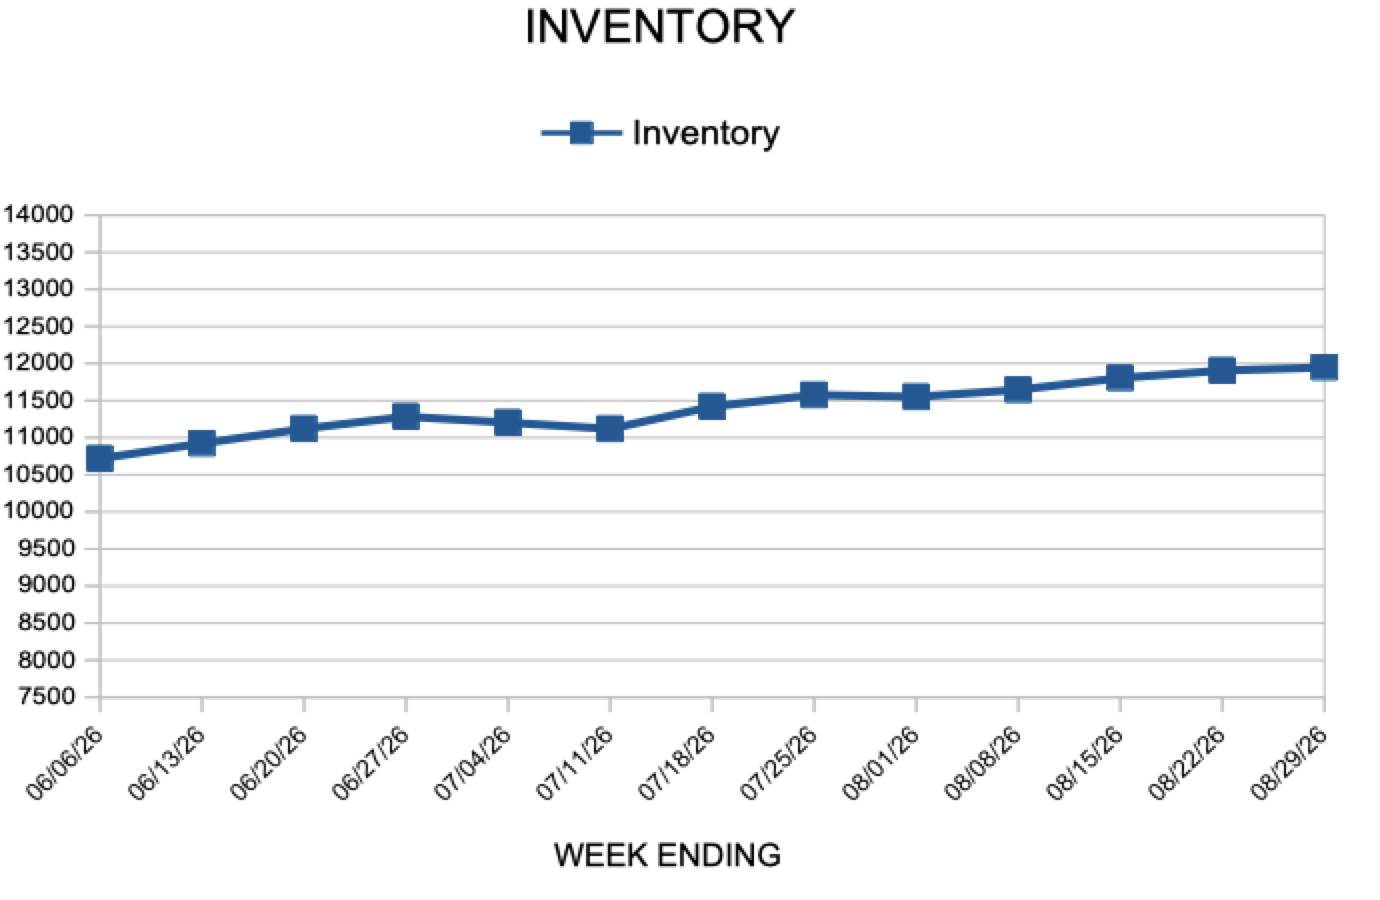
In the Twin Cities region, for the week ending July 11:
- New Listings decreased 3.8% to 1,818
- Pending Sales increased 0.9% to 965
- Inventory increased 7.1% to 11,119
For the month of June:
- Median Sales Price increased 2.1% to $410,000
- Days on Market increased 7.7% to 42
- Percent of Original List Price Received decreased 0.4% to 99.6%
- Months Supply of Homes For Sale increased 7.4% to 2.9
All comparisons are to 2025
Click here for the full Weekly Market Activity Report. From MAAR Market Data News.
Mortgage Rates Average 6.55%
The 30-year fixed-rate mortgage averaged 6.55% this week. Purchase application demand has weakened recently, but housing affordability is more favorable and housing inventory continues to rise, thus the backdrop for prospective homebuyers is modestly improving.
- The 30-year fixed-rate mortgage averaged 6.55% as of July 16, 2026, up from last week when it averaged 6.49%. A year ago at this time, the 30-year FRM averaged 6.75%.
- The 15-year fixed-rate mortgage averaged 5.93%, up from last week when it averaged 5.82%. A year ago at this time, the 15-year FRM averaged 5.92%.
Information provided by Freddie Mac.
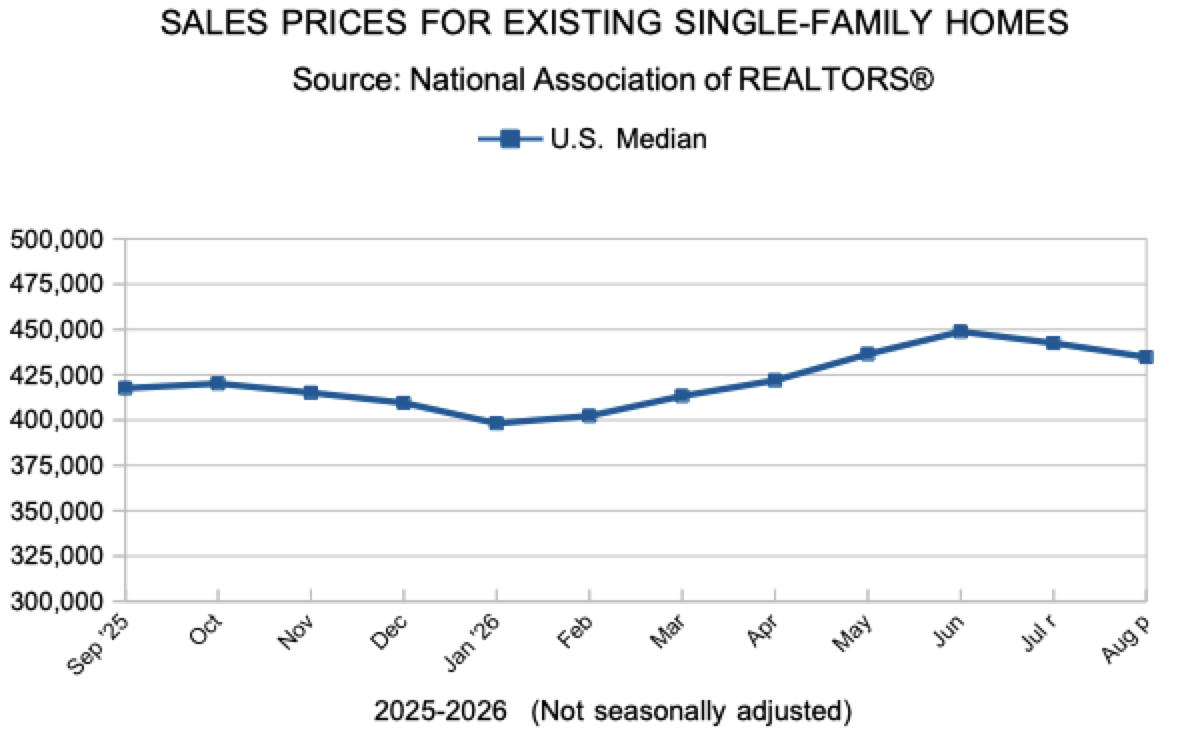
Existing Home Sales
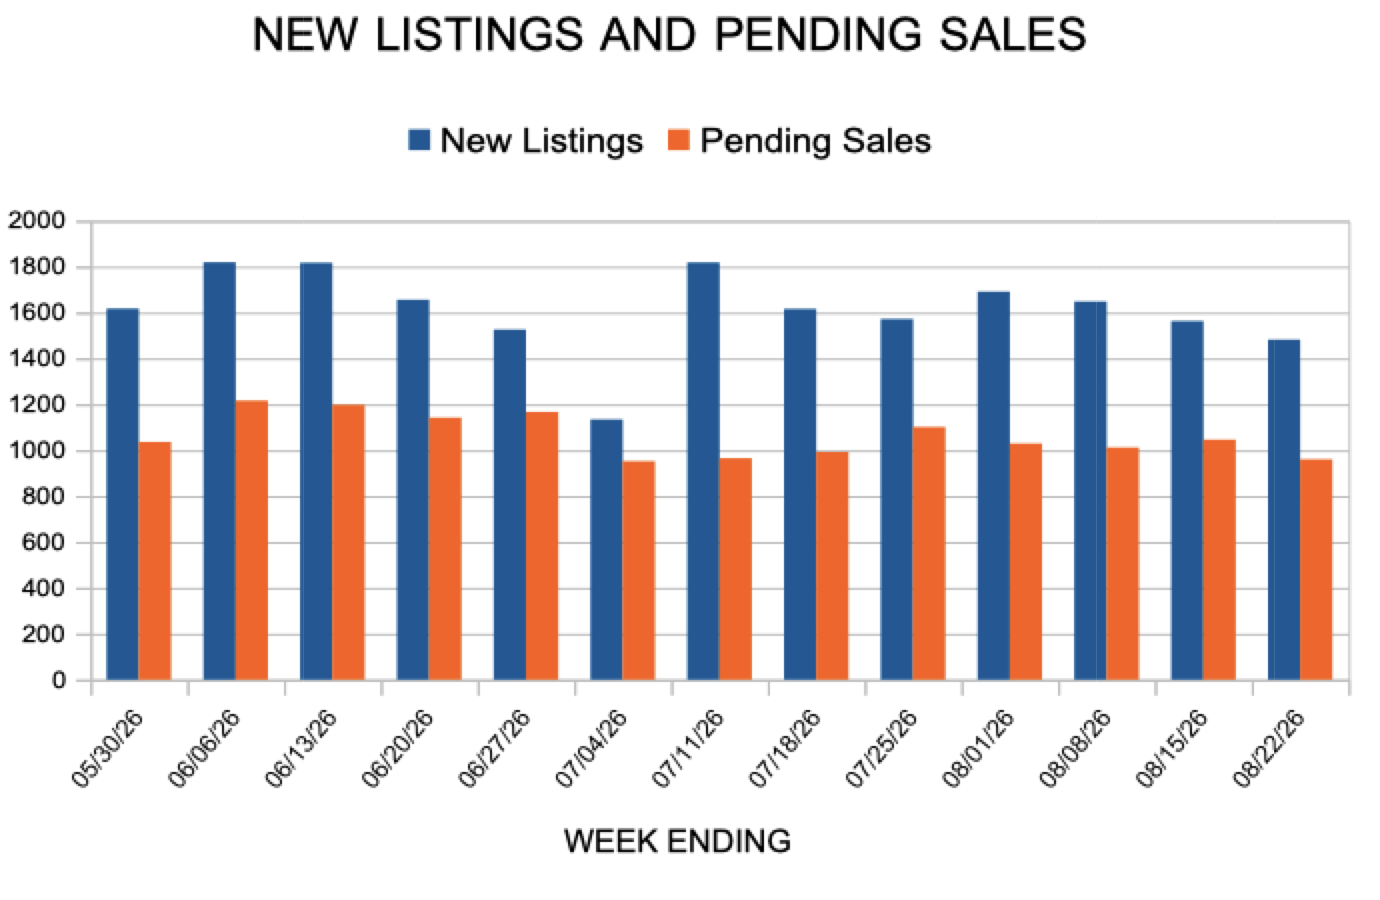
New Listings and Pending Sales
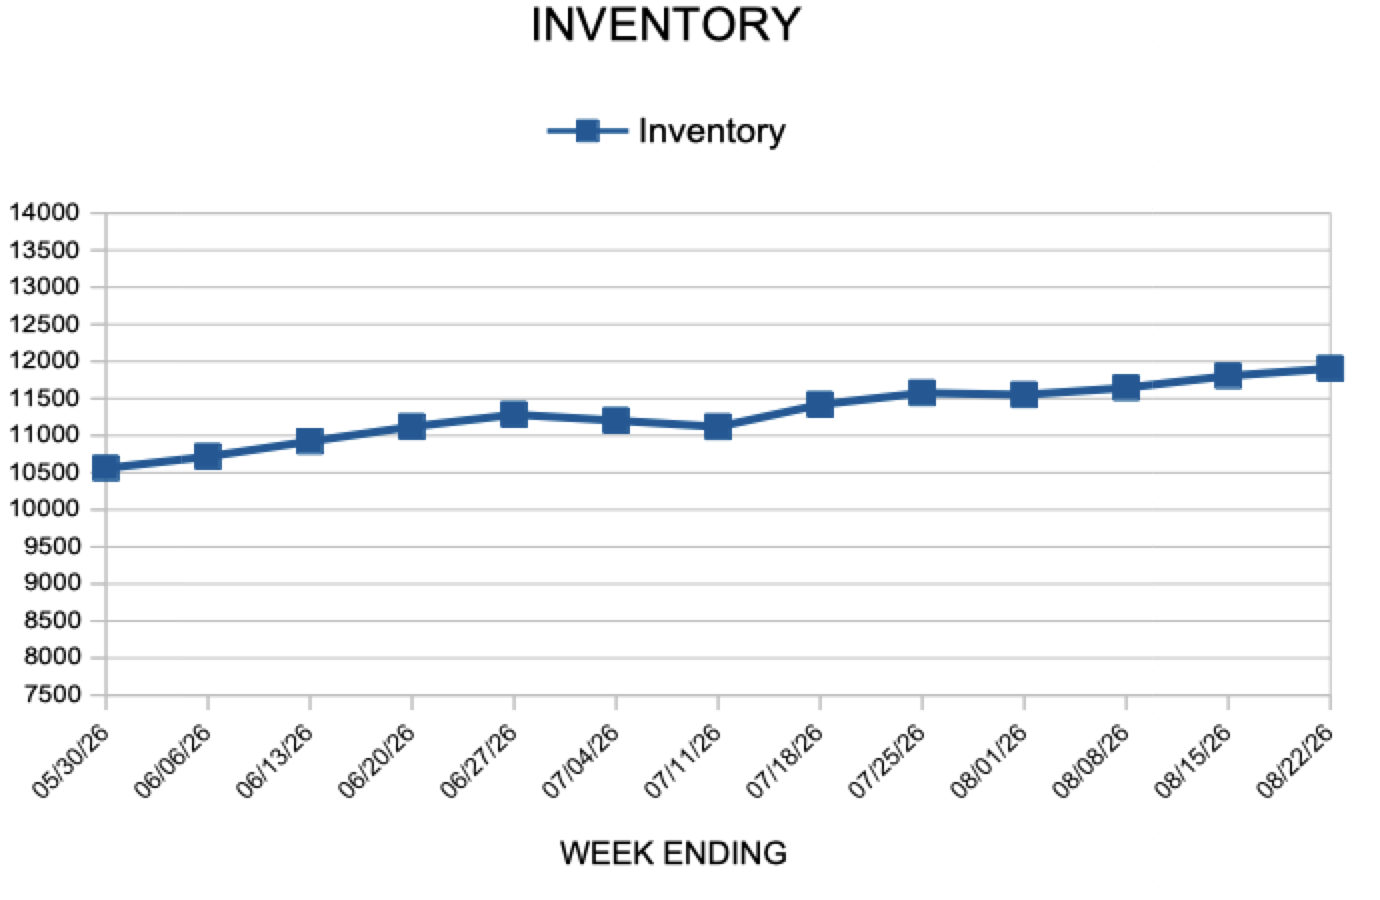
Inventory
Weekly Market Report
A new report from Realtor®.com found that new construction homes are more likely to sell below list price than existing homes. Condos and townhomes are also more likely to sell below list price than single-family homes. As of March 2026, the average single-family home sold for 99.2% of its final list price, while the average condo sold for 97.9% of its final list price.
In the Twin Cities region, for the week ending July 4:
- New Listings increased 5.3% to 1,134
- Pending Sales increased 1.9% to 952
- Inventory increased 8.1% to 11,203
For the month of May:
- Median Sales Price increased 1.1% to $399,450
- Days on Market increased 2.3% to 45
- Percent of Original List Price Received decreased 0.3% to 99.7%
- Months Supply of Homes For Sale increased 3.7% to 2.8
All comparisons are to 2025
Click here for the full Weekly Market Activity Report. From MAAR Market Data News.